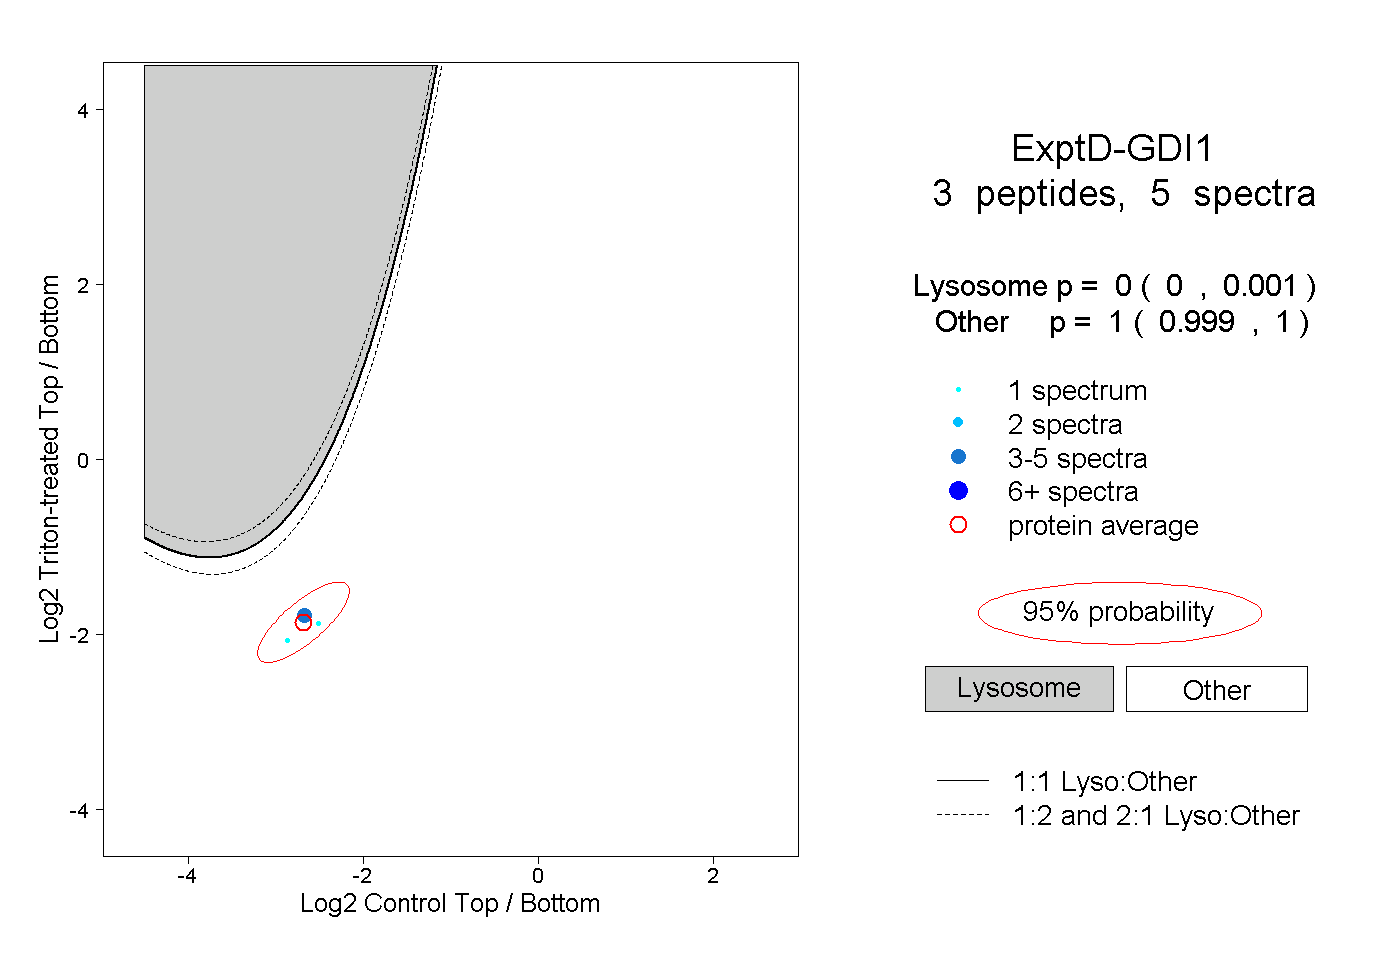
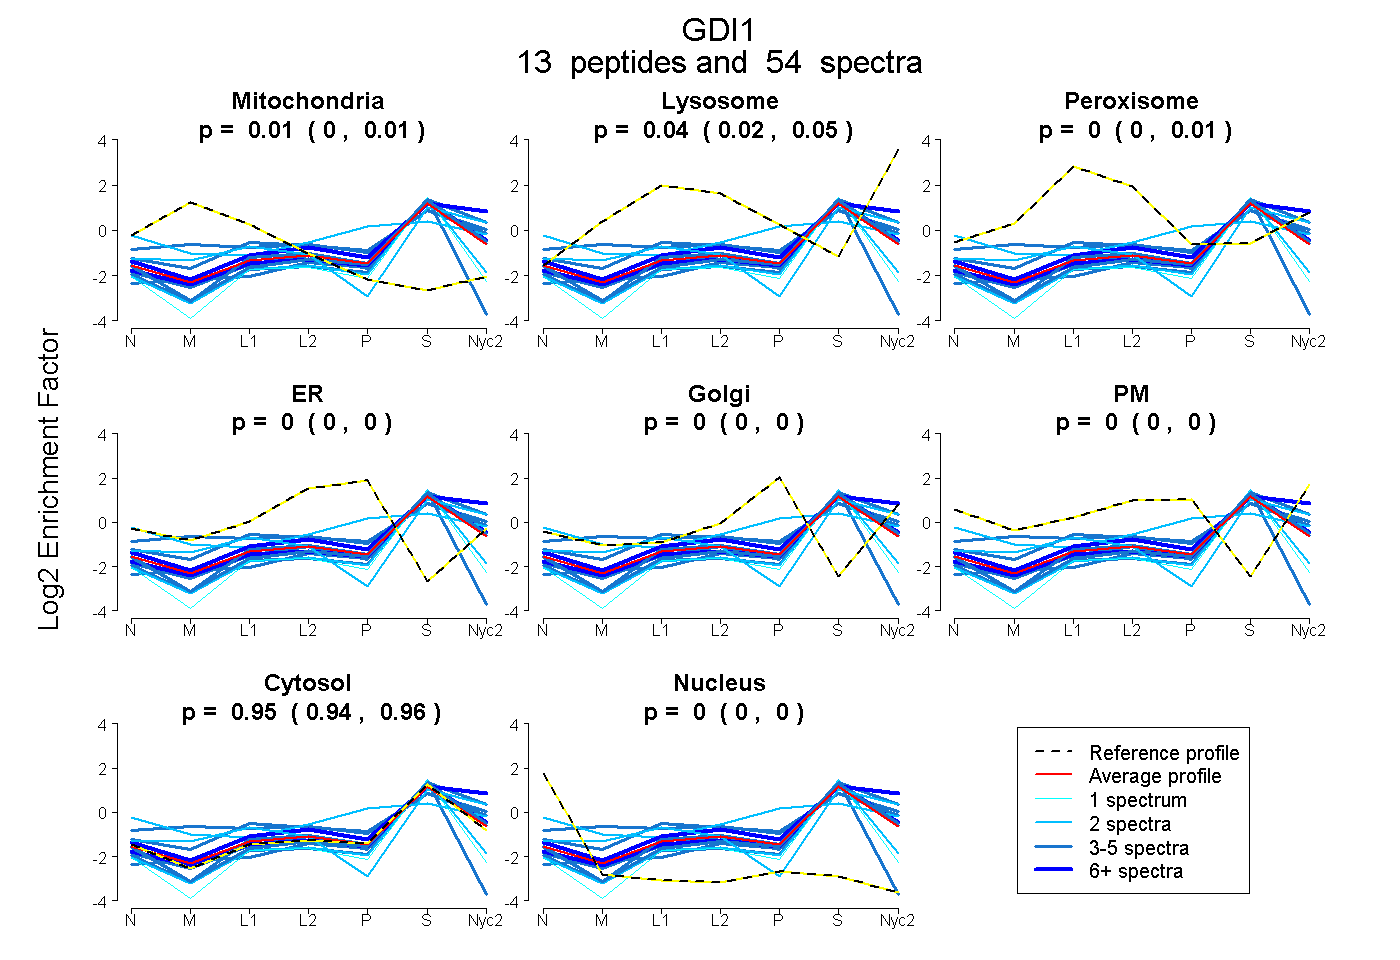
13
13peptides
spectra
0.000 | 0.015
0.024 | 0.050
0.000 | 0.009
0.000 | 0.000
0.000 | 0.000
0.000 | 0.000
0.944 | 0.959
0.000 | 0.000
7peptides
spectra
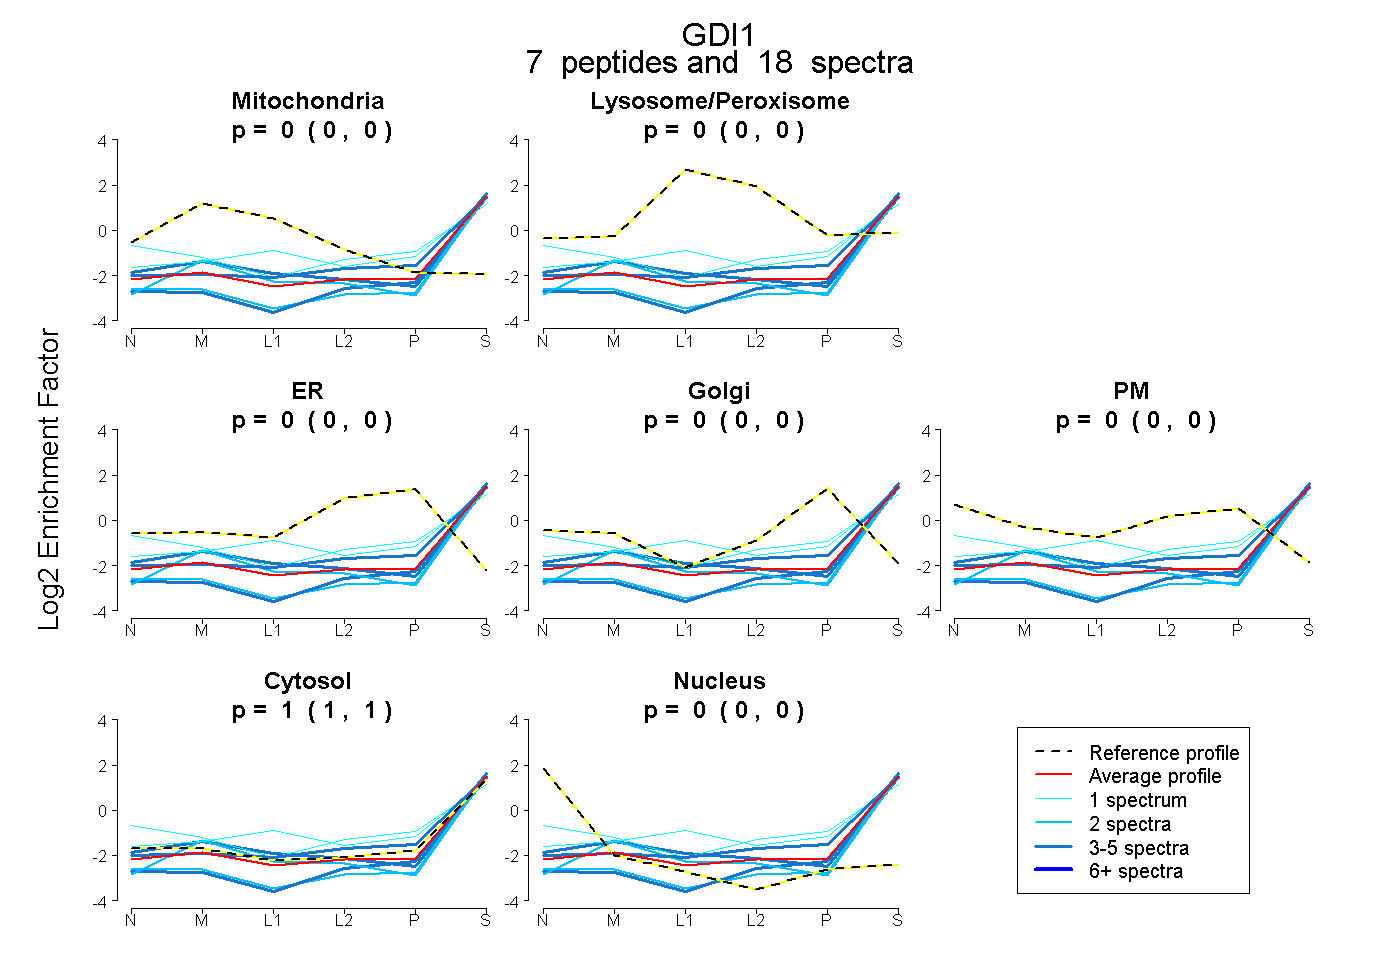
0.000 | 0.000
0.000 | 0.000
0.000 | 0.000
0.000 | 0.000
0.000 | 0.000
1.000 | 1.000
0.000 | 0.000
10peptides
spectra
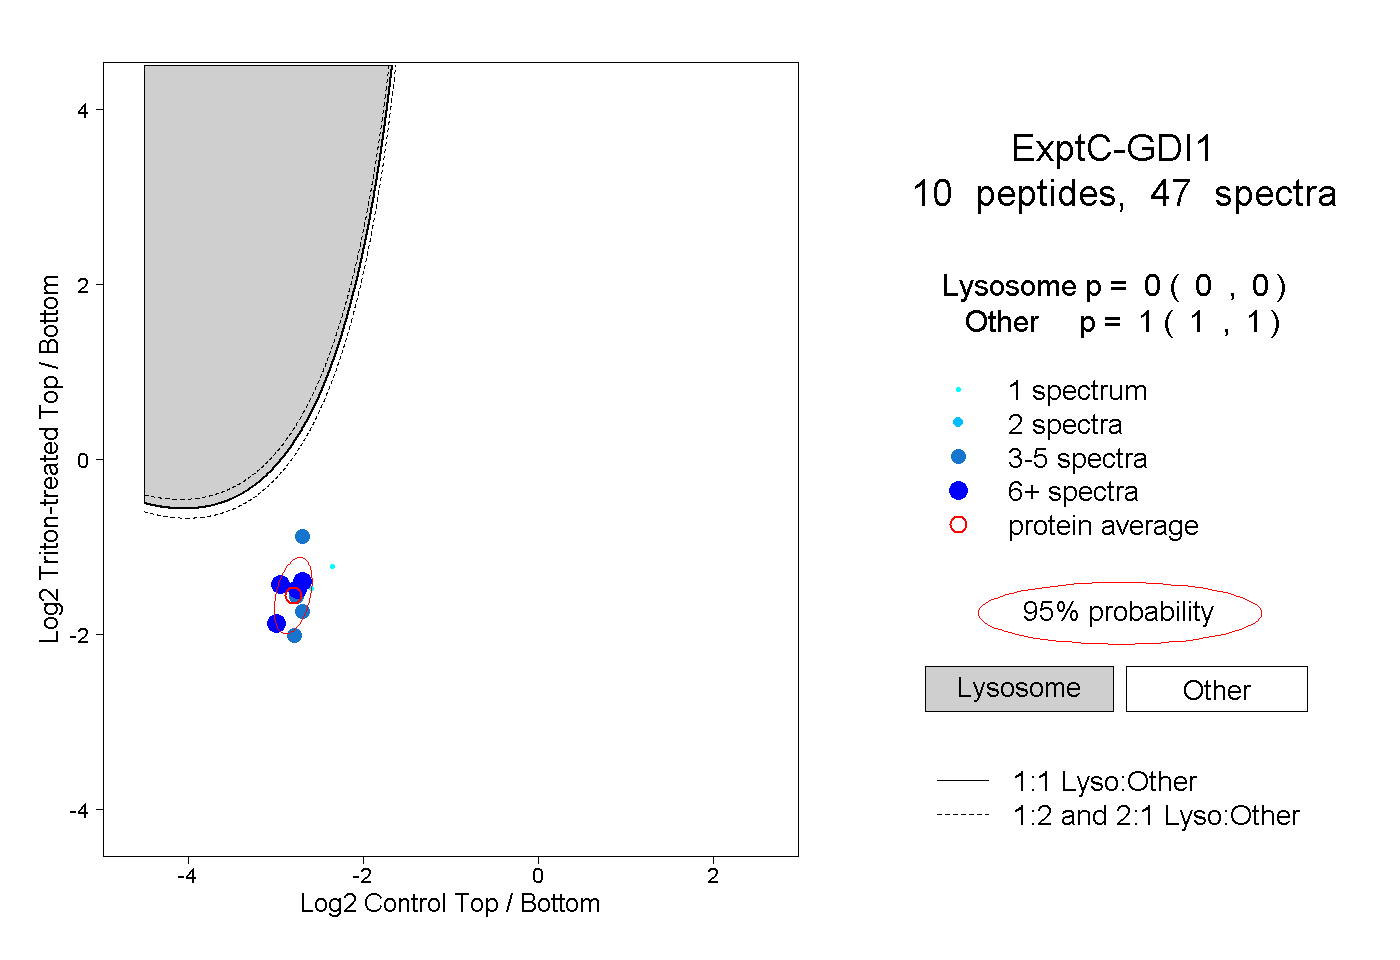
0.000 | 0.000
1.000 | 1.000