 13
13peptides
spectra
0.000 | 0.015
0.024 | 0.050
0.000 | 0.009
0.000 | 0.000
0.000 | 0.000
0.000 | 0.000
0.944 | 0.959
0.000 | 0.000
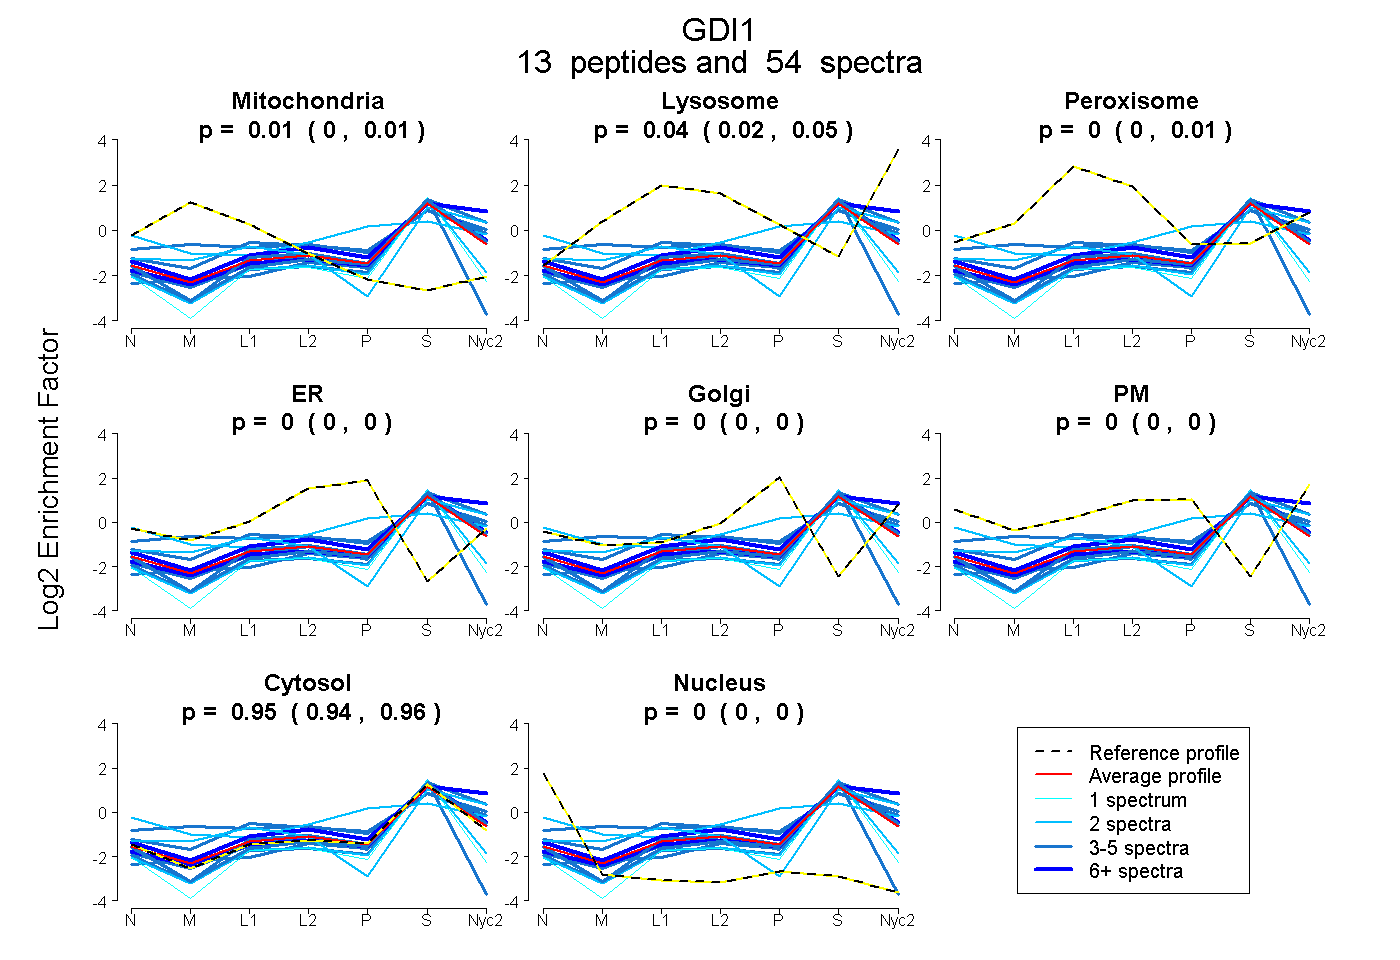
| Plot | Mito | Lyso | Perox | ER | Golgi | PM | Cytosol | Nucleus | |||||
| Expt A |
13 peptides |
54 spectra |
|
0.006 0.000 | 0.015 |
0.042 0.024 | 0.050 |
0.000 0.000 | 0.009 |
0.000 0.000 | 0.000 |
0.000 0.000 | 0.000 |
0.000 0.000 | 0.000 |
0.952 0.944 | 0.959 |
0.000 0.000 | 0.000 |
| 4 spectra, FQLLEGPPESMGR | 0.000 | 0.086 | 0.000 | 0.000 | 0.000 | 0.000 | 0.914 | 0.000 | ||
| 5 spectra, VLHMDR | 0.000 | 0.016 | 0.000 | 0.000 | 0.000 | 0.000 | 0.984 | 0.000 | ||
| 4 spectra, NPYYGGESSSITPLEELYK | 0.000 | 0.098 | 0.130 | 0.000 | 0.030 | 0.000 | 0.742 | 0.000 | ||
| 2 spectra, VPSTETEALASNLMGMFEK | 0.114 | 0.132 | 0.000 | 0.000 | 0.000 | 0.000 | 0.754 | 0.000 | ||
| 10 spectra, MLLYTEVTR | 0.000 | 0.030 | 0.000 | 0.000 | 0.000 | 0.000 | 0.970 | 0.000 | ||
| 5 spectra, IICILSHPIK | 0.000 | 0.000 | 0.000 | 0.000 | 0.000 | 0.000 | 0.824 | 0.176 | ||
| 1 spectrum, SDIYVCMISYAHNVAAQGK | 0.000 | 0.000 | 0.000 | 0.000 | 0.000 | 0.000 | 0.915 | 0.085 | ||
| 4 spectra, SEGEVAR | 0.000 | 0.000 | 0.000 | 0.000 | 0.000 | 0.000 | 1.000 | 0.000 | ||
| 2 spectra, QLICDPSYIPDR | 0.000 | 0.000 | 0.000 | 0.000 | 0.000 | 0.000 | 0.950 | 0.050 | ||
| 4 spectra, FLVFVANFDENDPK | 0.128 | 0.198 | 0.028 | 0.000 | 0.000 | 0.005 | 0.641 | 0.000 | ||
| 2 spectra, QNDVFGEADQ | 0.014 | 0.000 | 0.007 | 0.000 | 0.143 | 0.256 | 0.580 | 0.000 | ||
| 7 spectra, TFEGVDPQTTSMR | 0.000 | 0.204 | 0.000 | 0.000 | 0.000 | 0.000 | 0.796 | 0.000 | ||
| 4 spectra, MAGSAFDFENMK | 0.000 | 0.000 | 0.000 | 0.000 | 0.000 | 0.000 | 1.000 | 0.000 |
| Plot | Mito | Lyso or Perox | ER | Golgi | PM | Cytosol | Nucleus | ||||||
| Expt B |
7 peptides |
18 spectra |
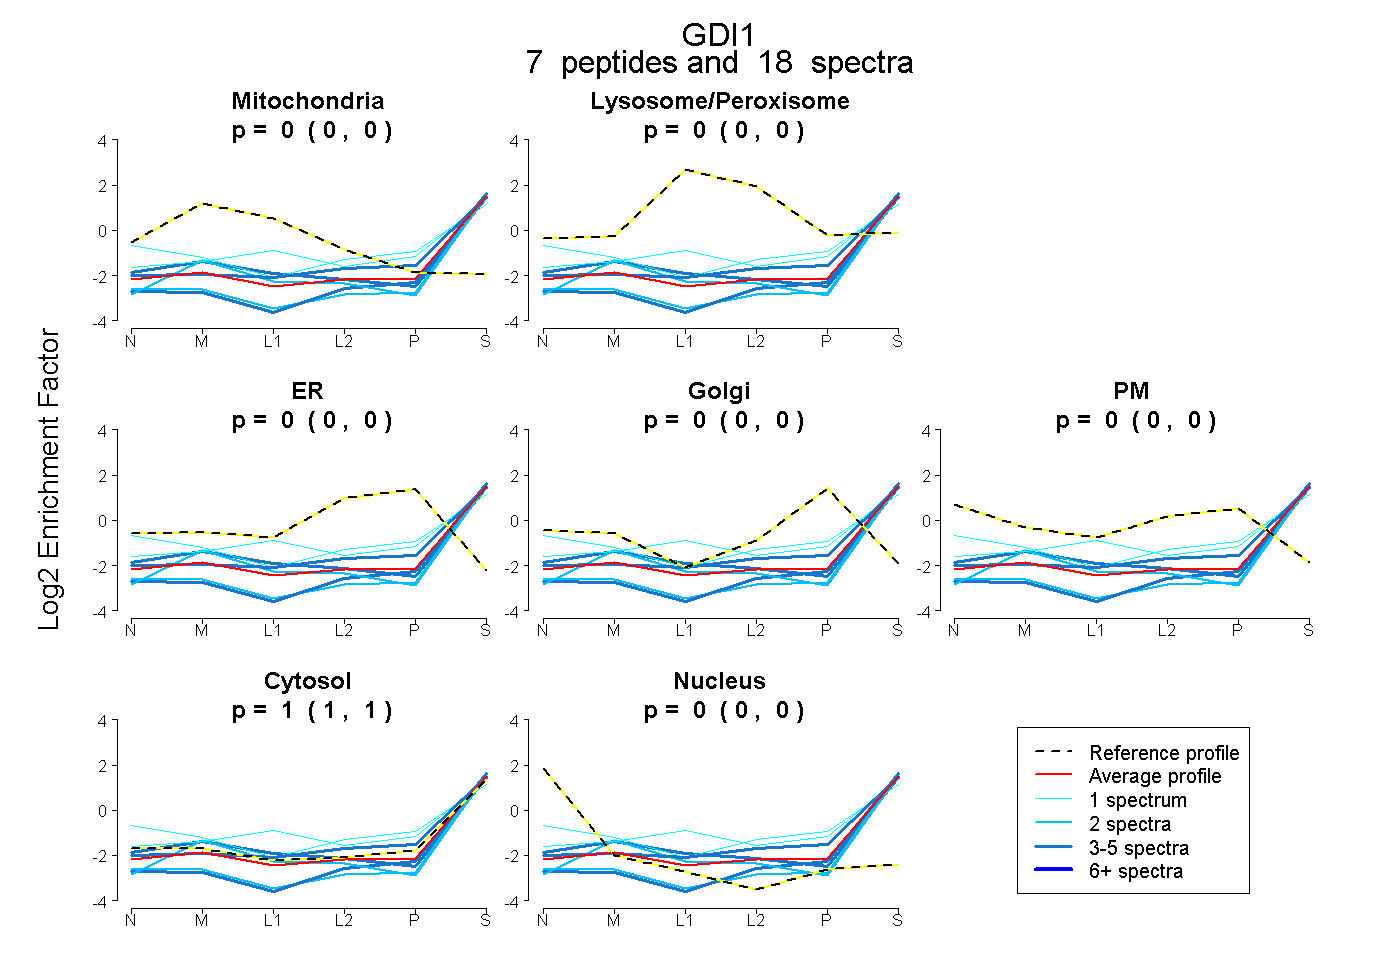 |
0.000 0.000 | 0.000 |
0.000 0.000 | 0.000 |
0.000 0.000 | 0.000 |
0.000 0.000 | 0.000 |
0.000 0.000 | 0.000 |
1.000 1.000 | 1.000 |
0.000 0.000 | 0.000 |
|||
| Plot | Lyso | Other | |||||||||||
| Expt C |
10 peptides |
47 spectra |
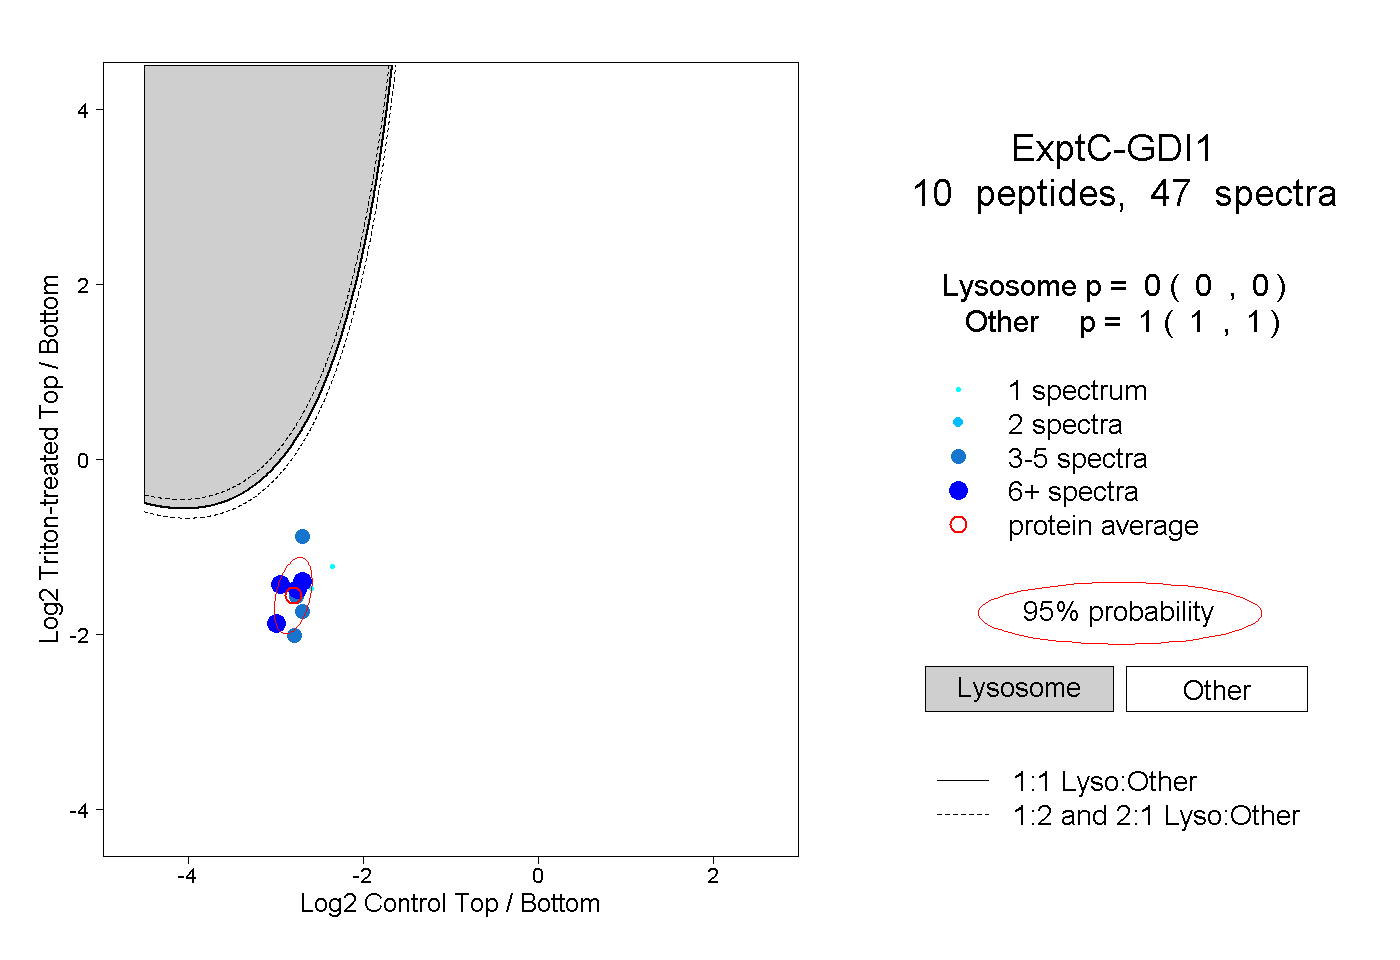 |
0.000 0.000 | 0.000 |
1.000 1.000 | 1.000 |
||||||||
| Plot | Lyso | Other | |||||||||||
| Expt D |
3 peptides |
5 spectra |
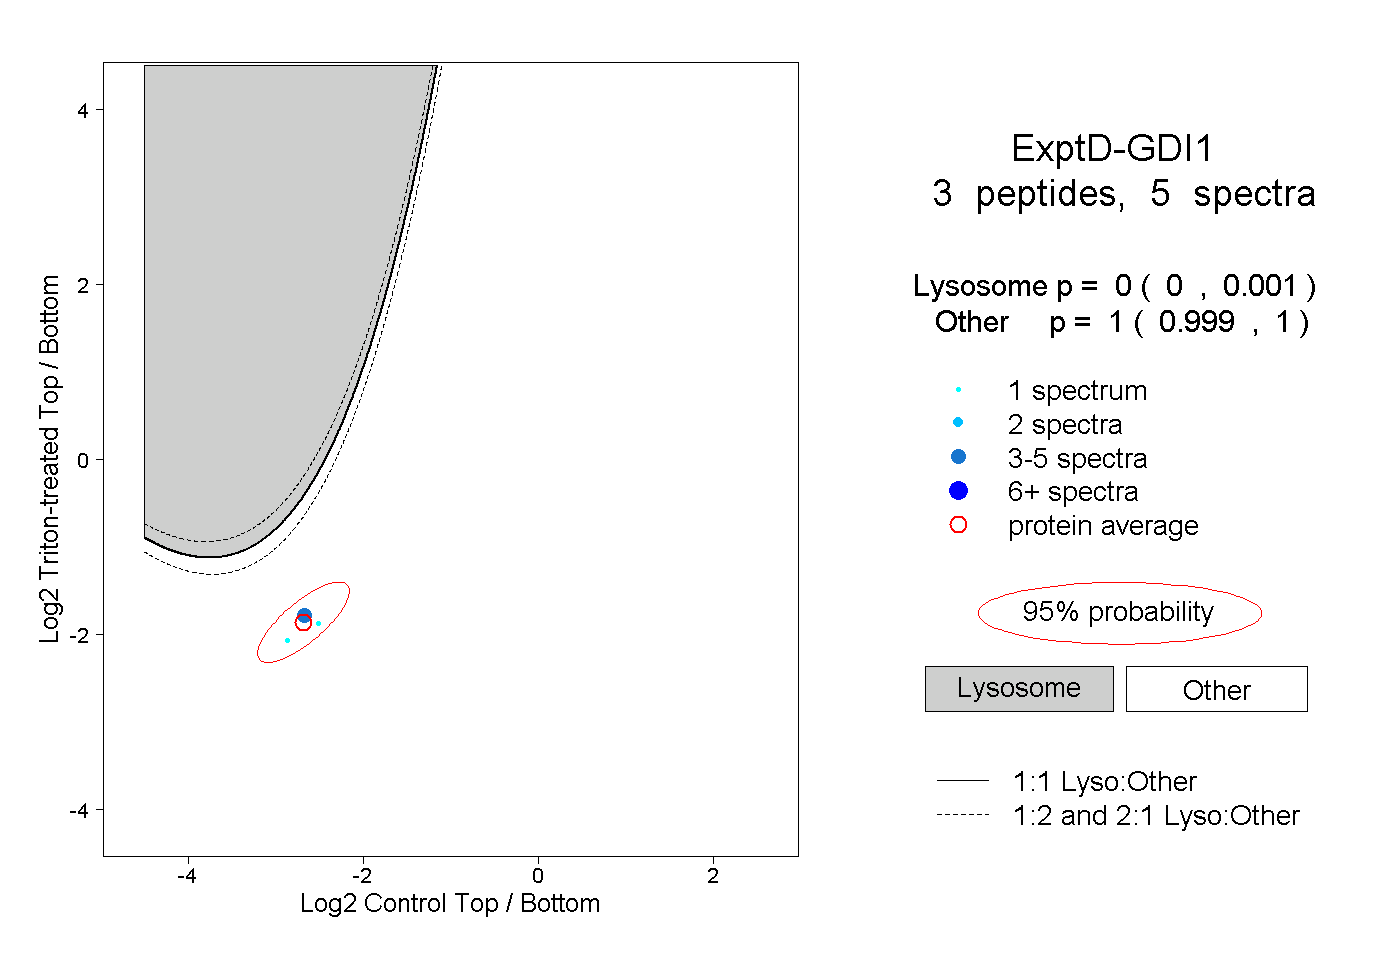 |
0.000 0.000 | 0.001 |
1.000 0.999 | 1.000 |