 3
3peptides
spectra
0.000 | 0.000
0.051 | 0.319
0.000 | 0.073
0.000 | 0.081
0.000 | 0.094
0.000 | 0.152
0.624 | 0.745
0.000 | 0.000
4peptides
spectra
0.000 | 0.000
1.000 | 1.000
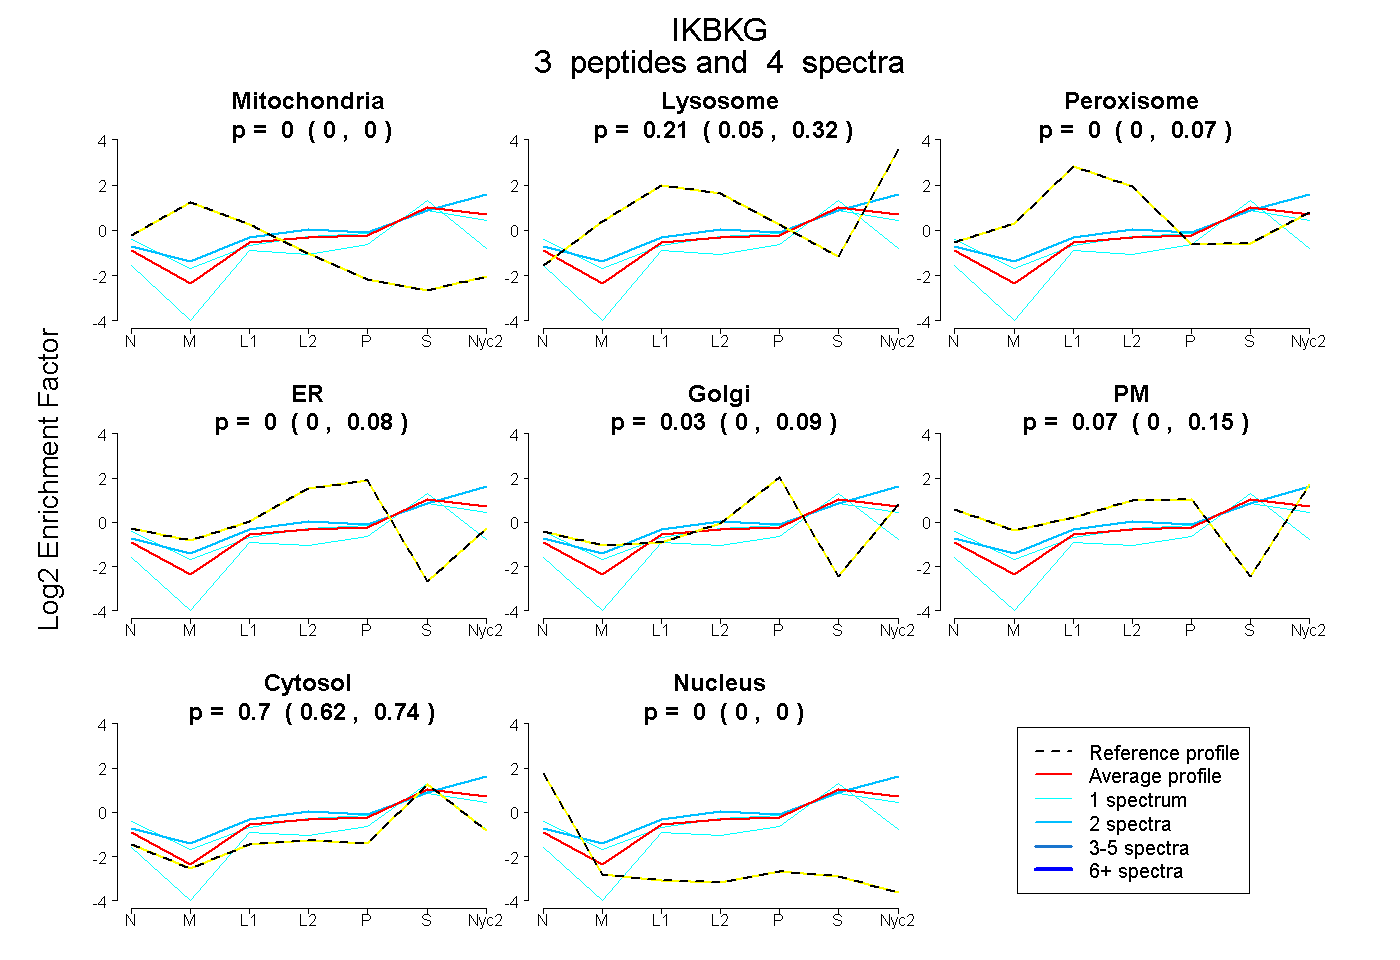
| Plot | Mito | Lyso | Perox | ER | Golgi | PM | Cytosol | Nucleus | |||||
| Expt A |
3 peptides |
4 spectra |
|
0.000 0.000 | 0.000 |
0.212 0.051 | 0.319 |
0.000 0.000 | 0.073 |
0.000 0.000 | 0.081 |
0.026 0.000 | 0.094 |
0.066 0.000 | 0.152 |
0.696 0.624 | 0.745 |
0.000 0.000 | 0.000 |
||
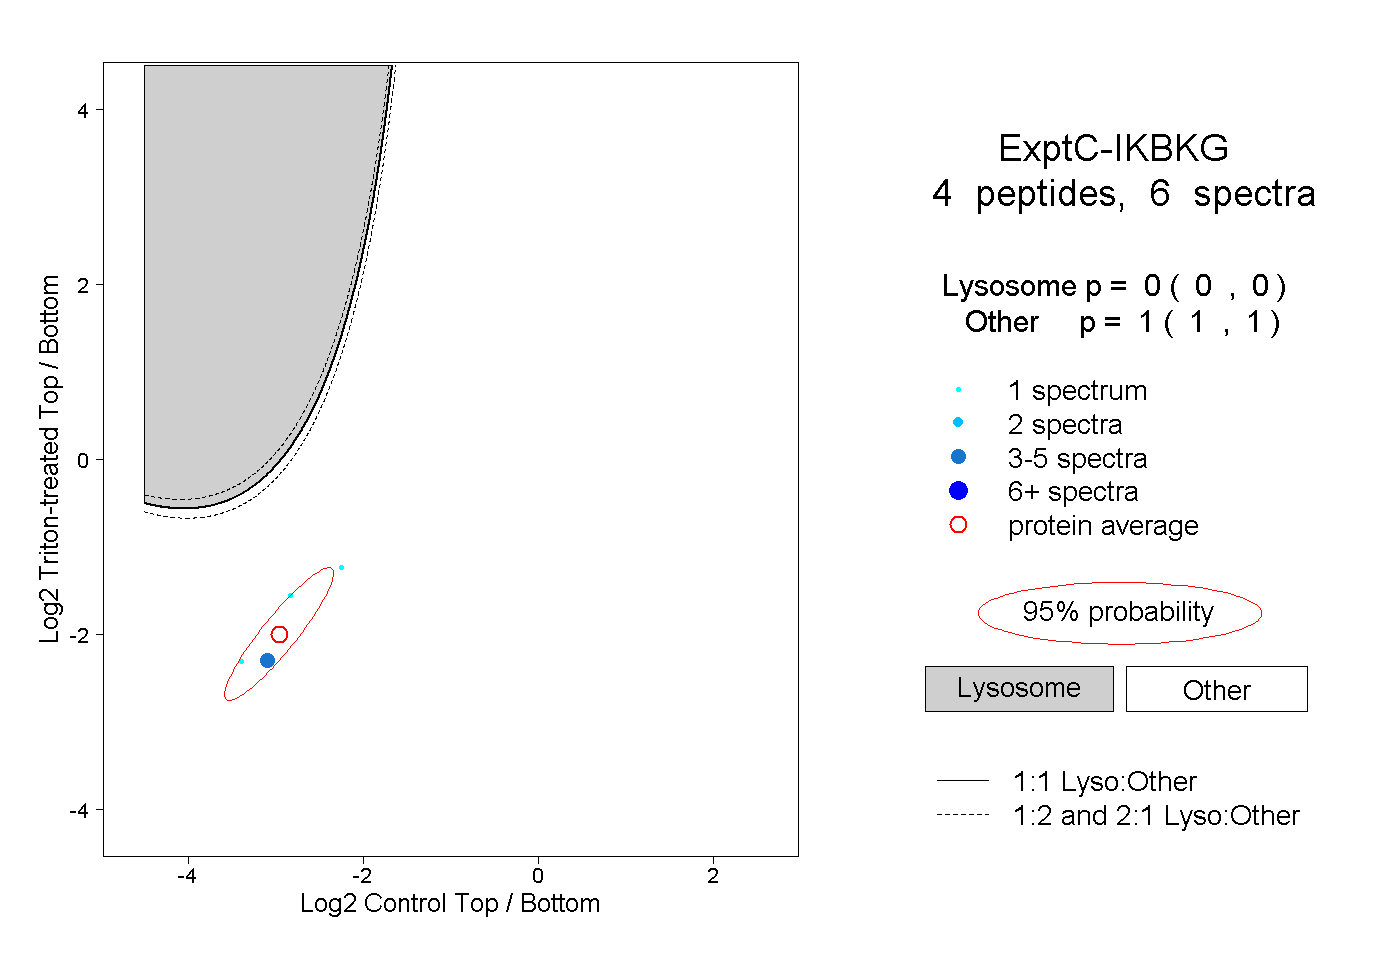
| Plot | Lyso | Other | |||||||||||
| Expt C |
4 peptides |
6 spectra |
|
0.000 0.000 | 0.000 |
1.000 1.000 | 1.000 |