 7
7peptides
spectra
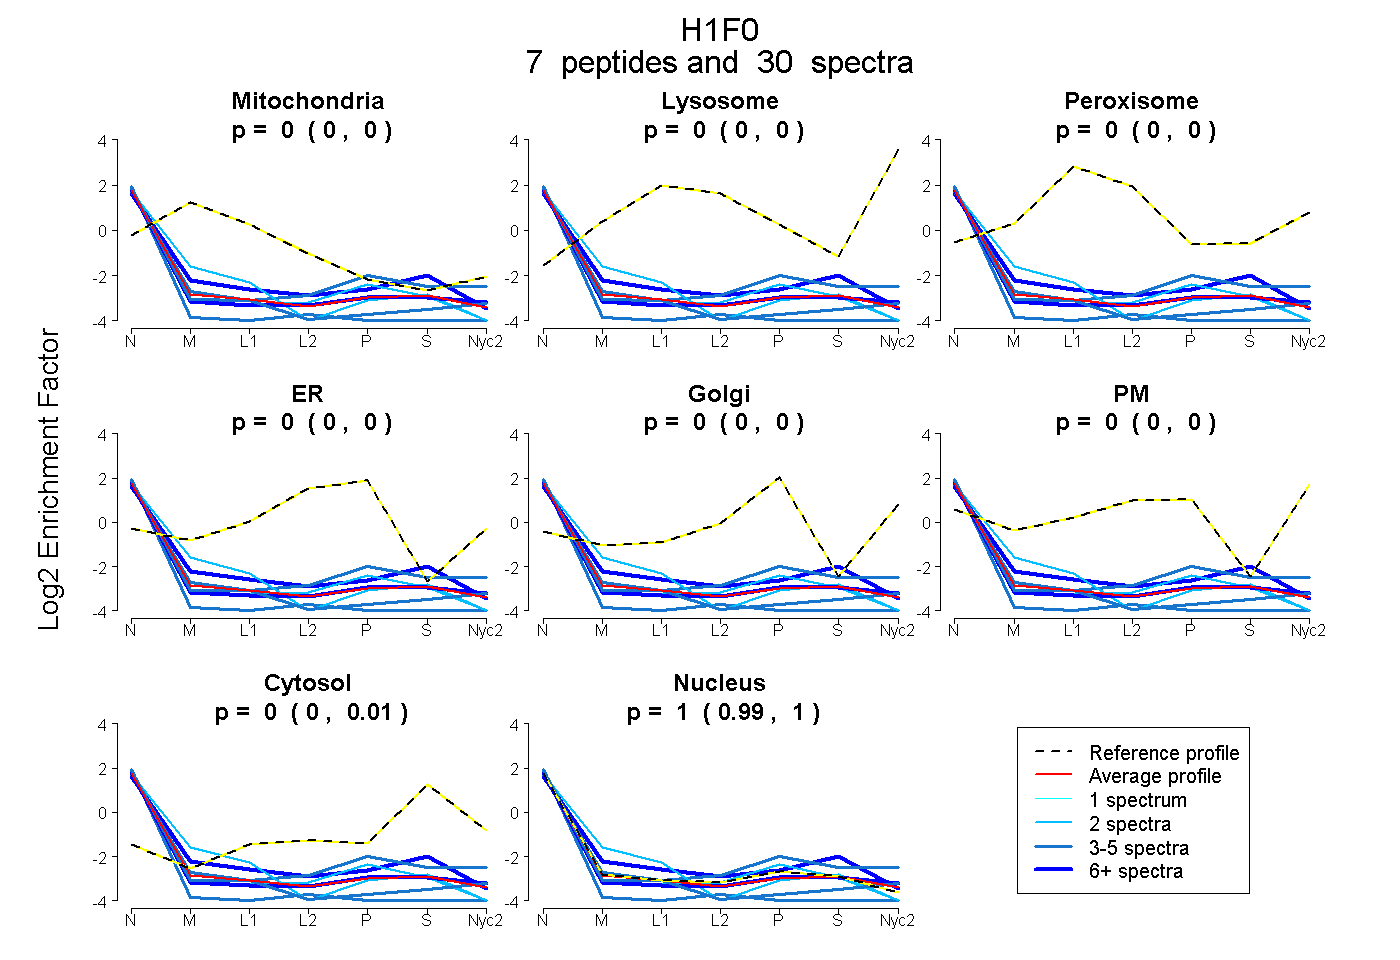
0.000 | 0.000
0.000 | 0.003
0.000 | 0.000
0.000 | 0.000
0.000 | 0.000
0.000 | 0.000
0.000 | 0.006
0.992 | 1.000
2peptides
spectra
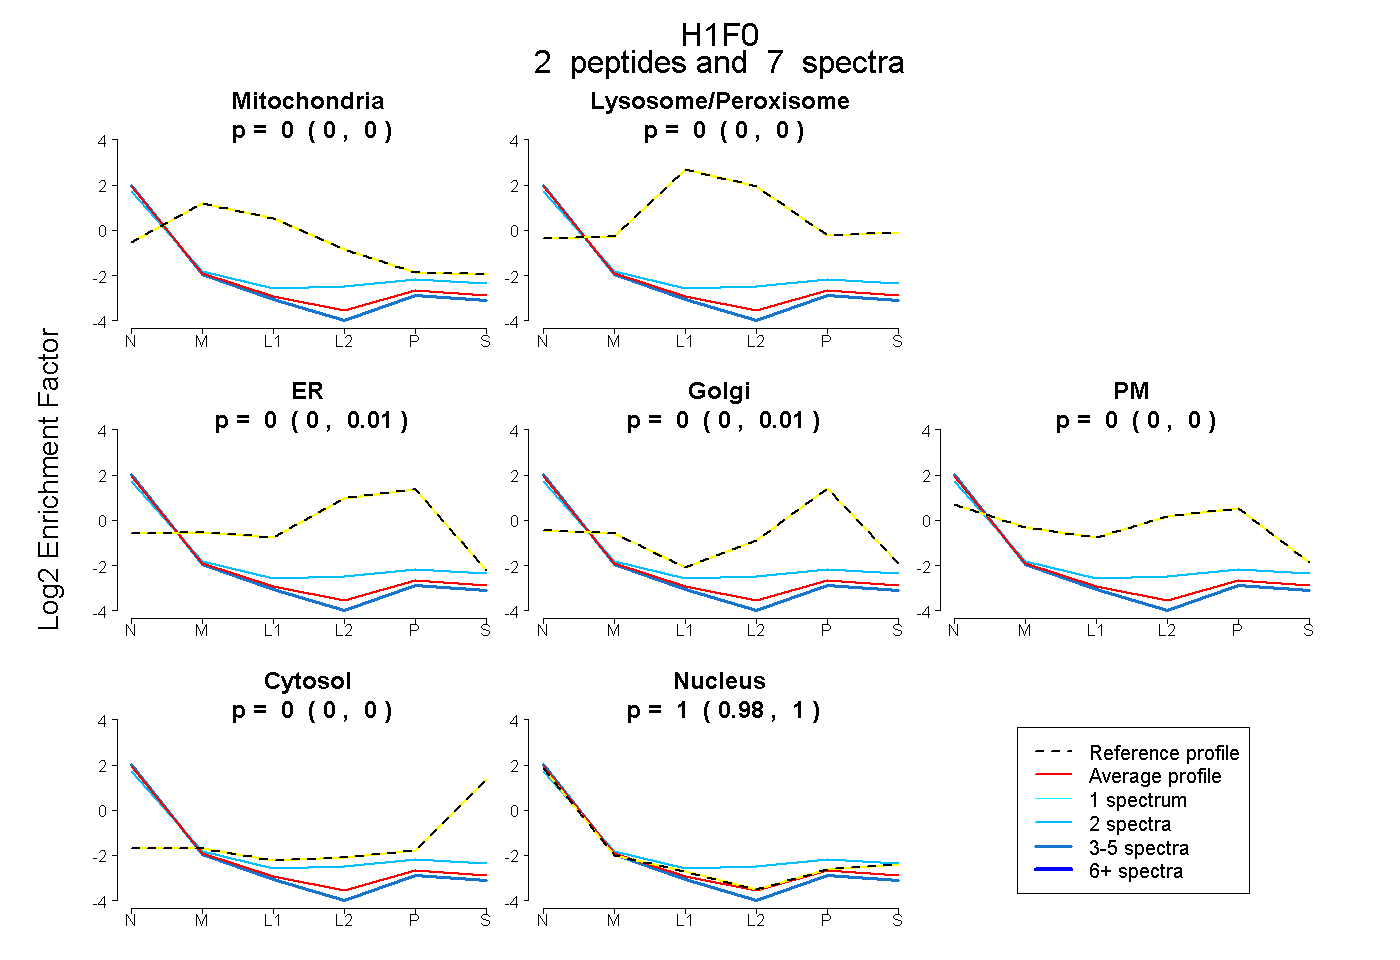
0.000 | 0.000
0.000 | 0.000
0.000 | 0.005
0.000 | 0.008
0.000 | 0.000
0.000 | 0.000
0.975 | 1.000
2peptides
spectra
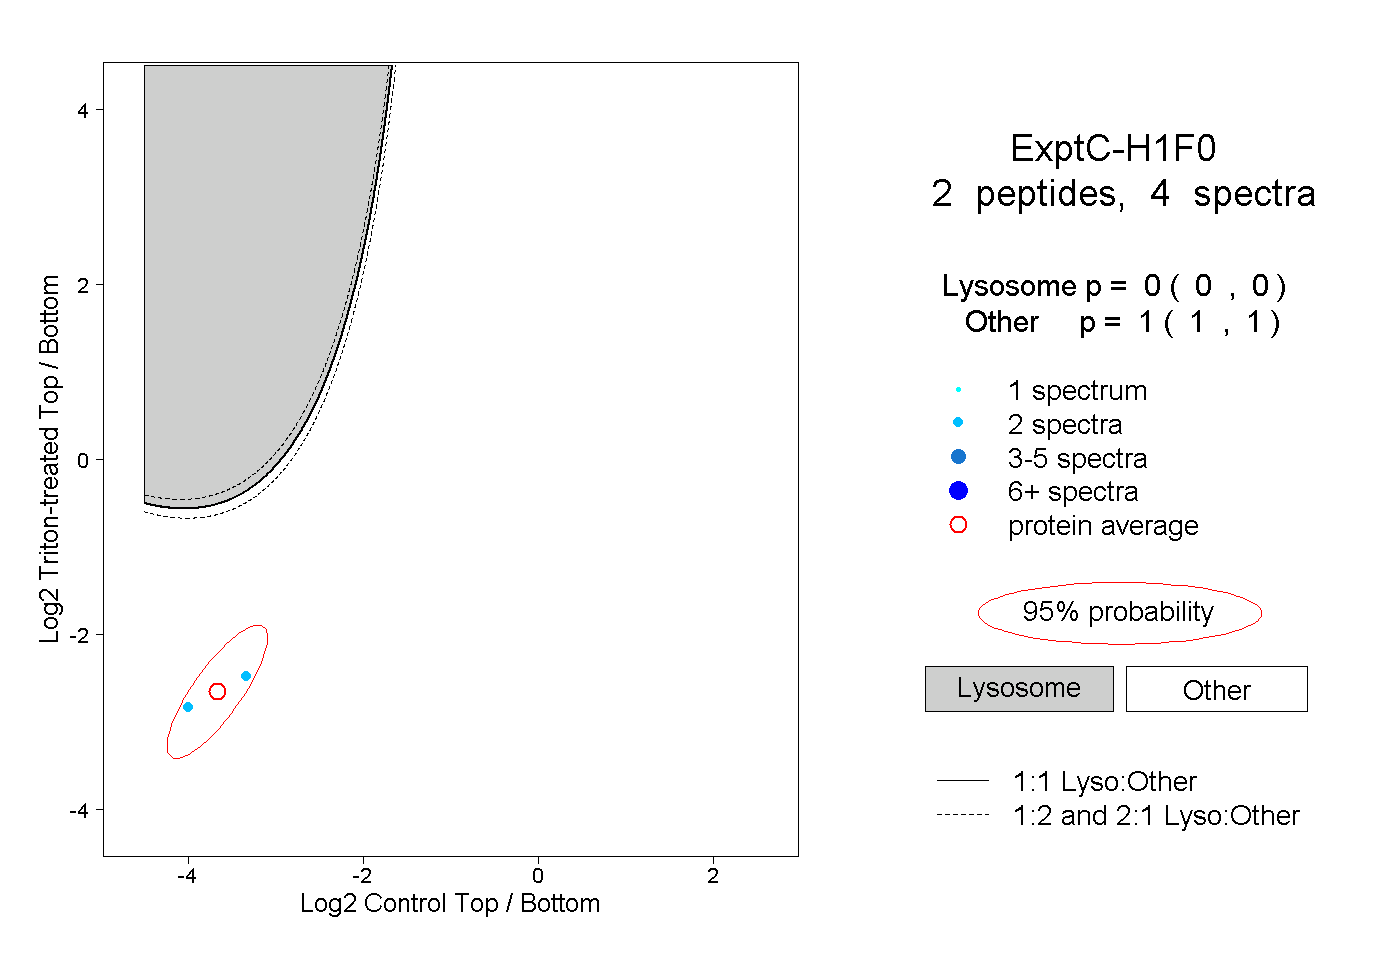
0.000 | 0.000
1.000 | 1.000