 3
3peptides
spectra
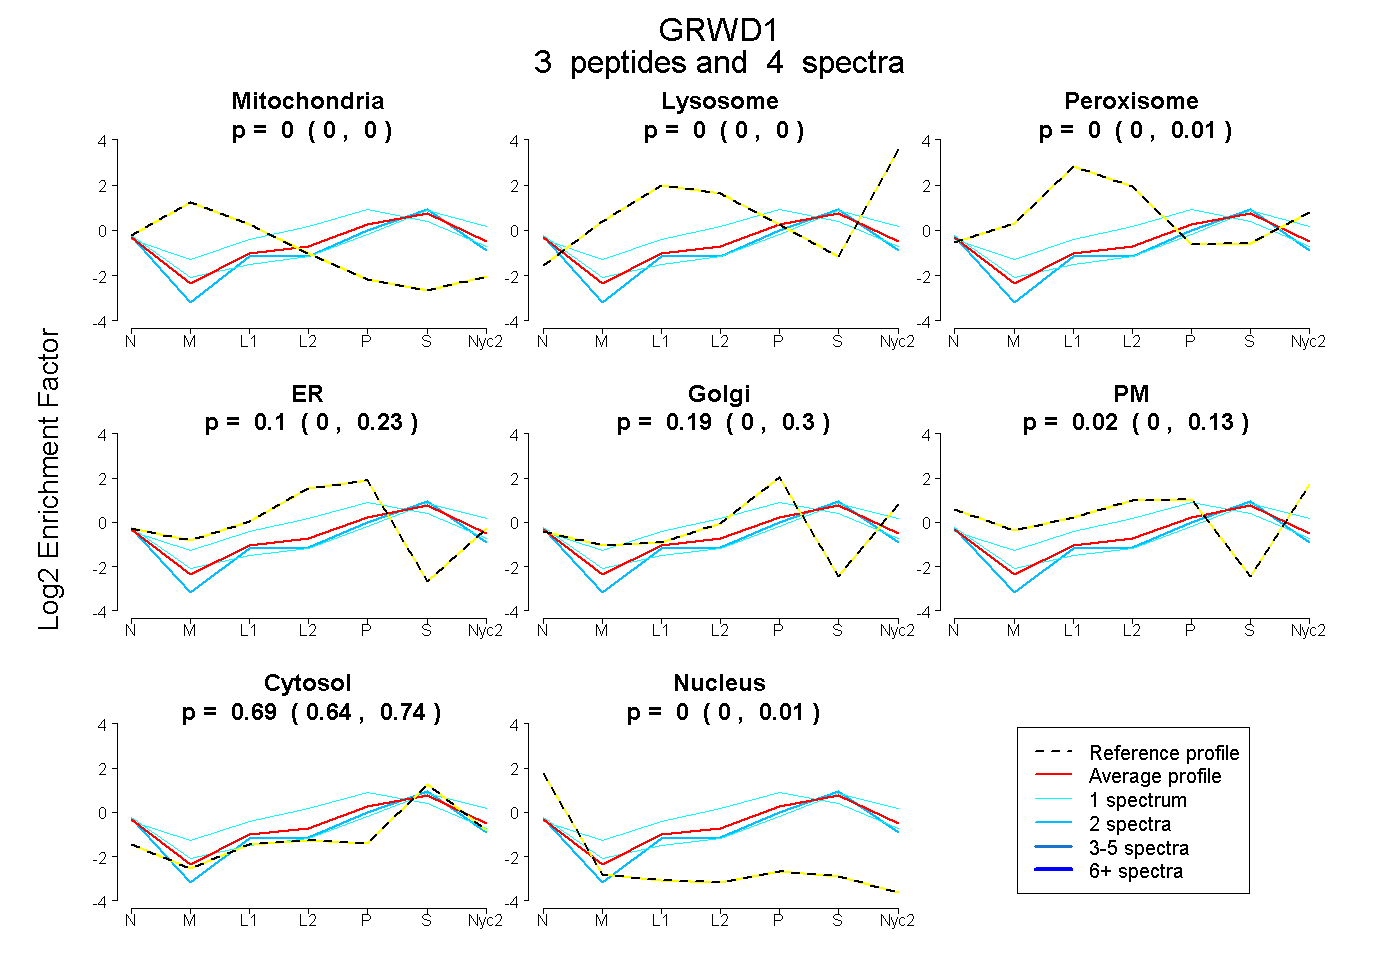
0.000 | 0.000
0.000 | 0.000
0.000 | 0.014
0.000 | 0.232
0.000 | 0.304
0.000 | 0.135
0.640 | 0.735
0.000 | 0.012
| Plot | Mito | Lyso | Perox | ER | Golgi | PM | Cytosol | Nucleus | |||||
| Expt A |
3 peptides |
4 spectra |
|
0.000 0.000 | 0.000 |
0.000 0.000 | 0.000 |
0.000 0.000 | 0.014 |
0.096 0.000 | 0.232 |
0.189 0.000 | 0.304 |
0.021 0.000 | 0.135 |
0.693 0.640 | 0.735 |
0.000 0.000 | 0.012 |
| 1 spectrum, SGSPVATFK | 0.000 | 0.000 | 0.080 | 0.425 | 0.000 | 0.000 | 0.495 | 0.000 | ||
| 1 spectrum, LLTGDCQK | 0.000 | 0.000 | 0.000 | 0.000 | 0.146 | 0.127 | 0.727 | 0.000 | ||
| 2 spectra, AQTGAPCLSFDIVR | 0.000 | 0.000 | 0.000 | 0.030 | 0.151 | 0.000 | 0.776 | 0.042 |
| Plot | Lyso | Other | |||||||||||
| Expt C |
1 peptide |
1 spectrum |
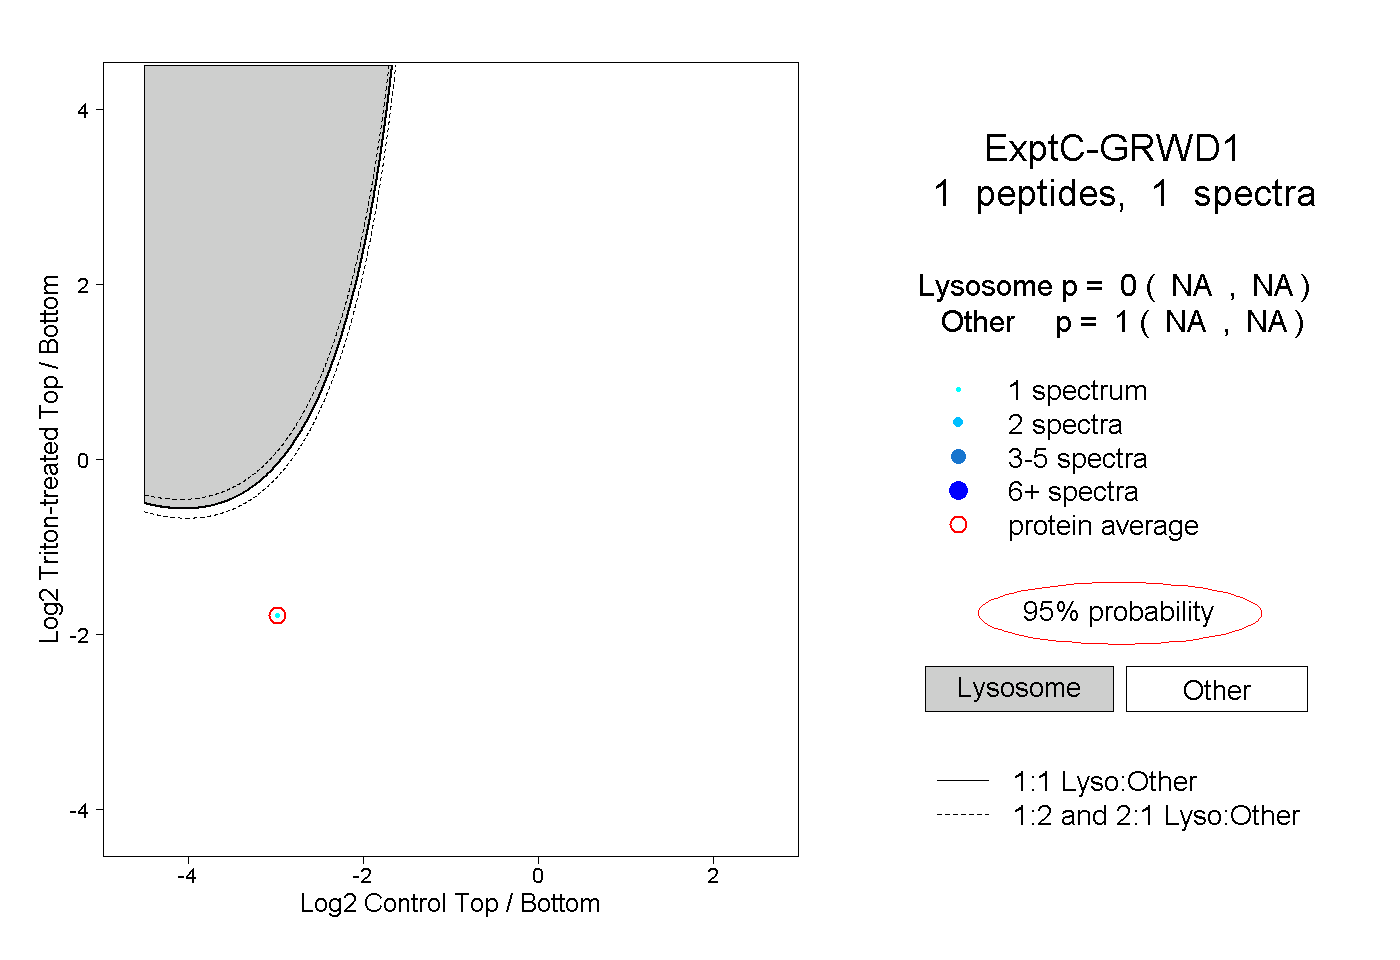 |
0.000 NA | NA |
1.000 NA | NA |