 1
1peptide
spectra
0.471 | 0.566
0.000 | 0.000
0.192 | 0.272
0.000 | 0.032
0.000 | 0.018
0.000 | 0.000
0.184 | 0.262
0.000 | 0.000
1peptide
spectrum
NA | NA
NA | NA
| Plot | Mito | Lyso | Perox | ER | Golgi | PM | Cytosol | Nucleus | |||||
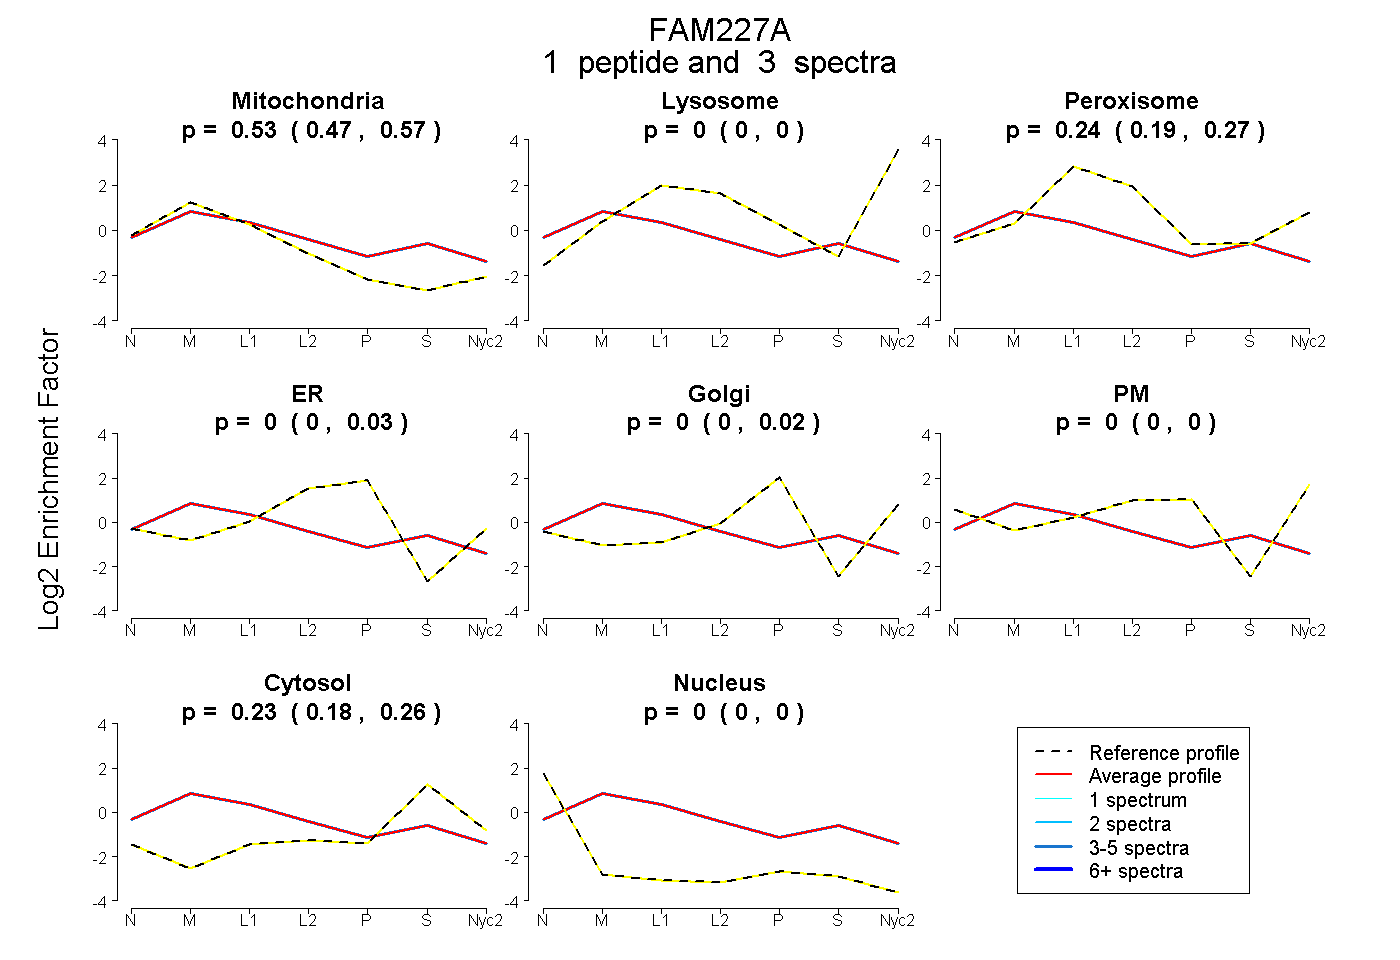
| Expt A |
1 peptide |
3 spectra |
|
0.528 0.471 | 0.566 |
0.000 0.000 | 0.000 |
0.244 0.192 | 0.272 |
0.000 0.000 | 0.032 |
0.000 0.000 | 0.018 |
0.000 0.000 | 0.000 |
0.228 0.184 | 0.262 |
0.000 0.000 | 0.000 |
||
| Plot | Lyso | Other | |||||||||||
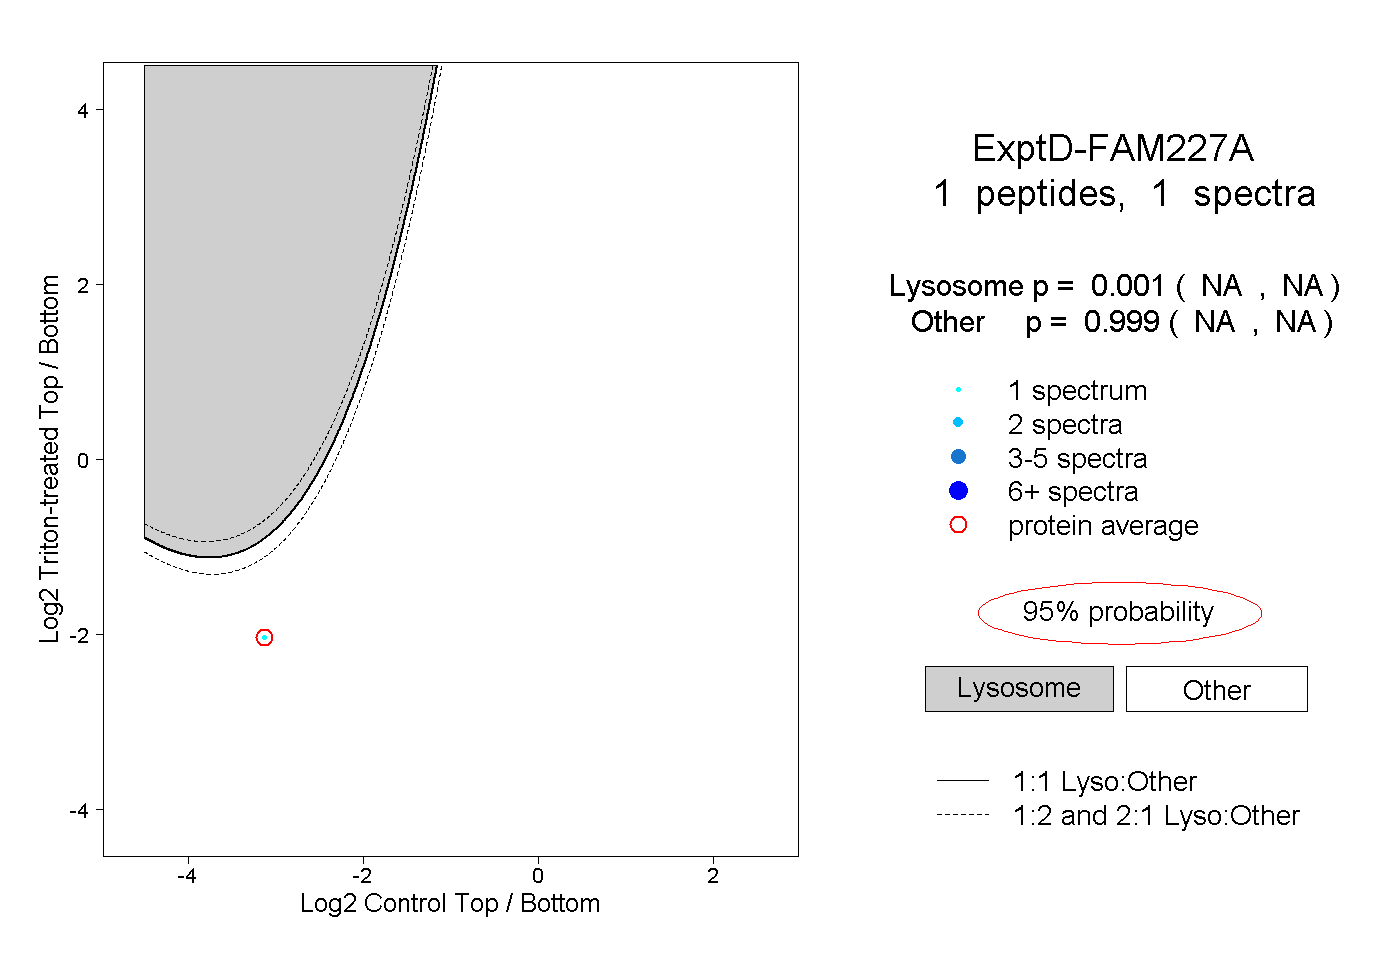
| Expt D |
1 peptide |
1 spectrum |
|
0.001 NA | NA |
0.999 NA | NA |