 12
12peptides
spectra

0.000 | 0.000
0.000 | 0.000
0.000 | 0.000
0.307 | 0.366
0.000 | 0.060
0.000 | 0.000
0.449 | 0.463
0.165 | 0.188
1peptide
spectrum
NA | NA
NA | NA
| Plot | Mito | Lyso | Perox | ER | Golgi | PM | Cytosol | Nucleus | |||||
| Expt A |
12 peptides |
27 spectra |
|
0.000 0.000 | 0.000 |
0.000 0.000 | 0.000 |
0.000 0.000 | 0.000 |
0.349 0.307 | 0.366 |
0.016 0.000 | 0.060 |
0.000 0.000 | 0.000 |
0.457 0.449 | 0.463 |
0.177 0.165 | 0.188 |
||
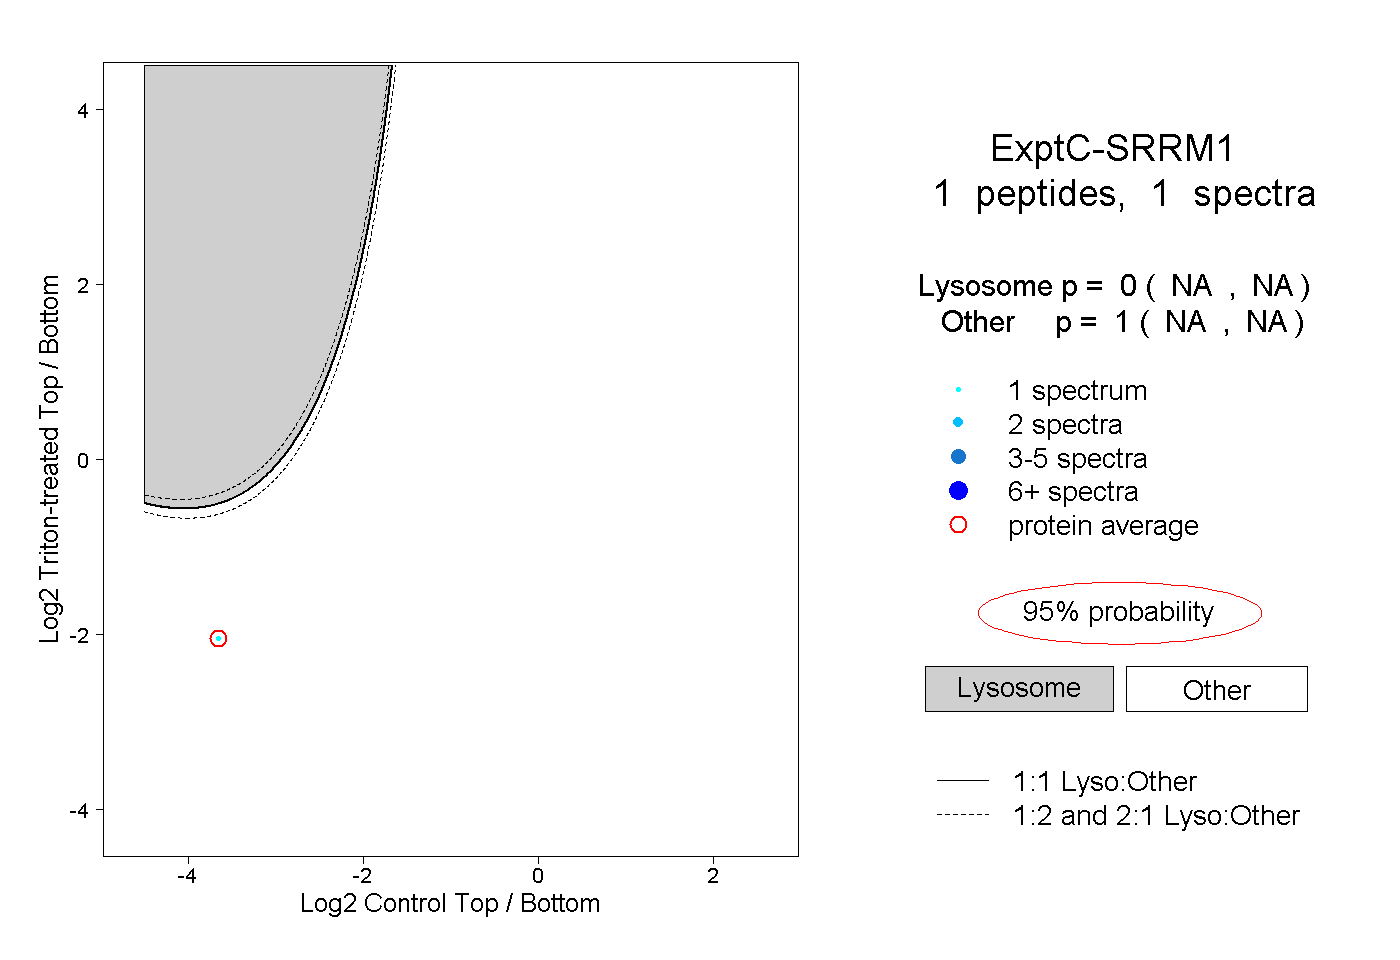
| Plot | Lyso | Other | |||||||||||
| Expt C |
1 peptide |
1 spectrum |
|
0.000 NA | NA |
1.000 NA | NA |