 9
9peptides
spectra
0.668 | 0.700
0.131 | 0.172
0.000 | 0.000
0.000 | 0.000
0.000 | 0.000
0.142 | 0.178
0.000 | 0.000
0.000 | 0.000
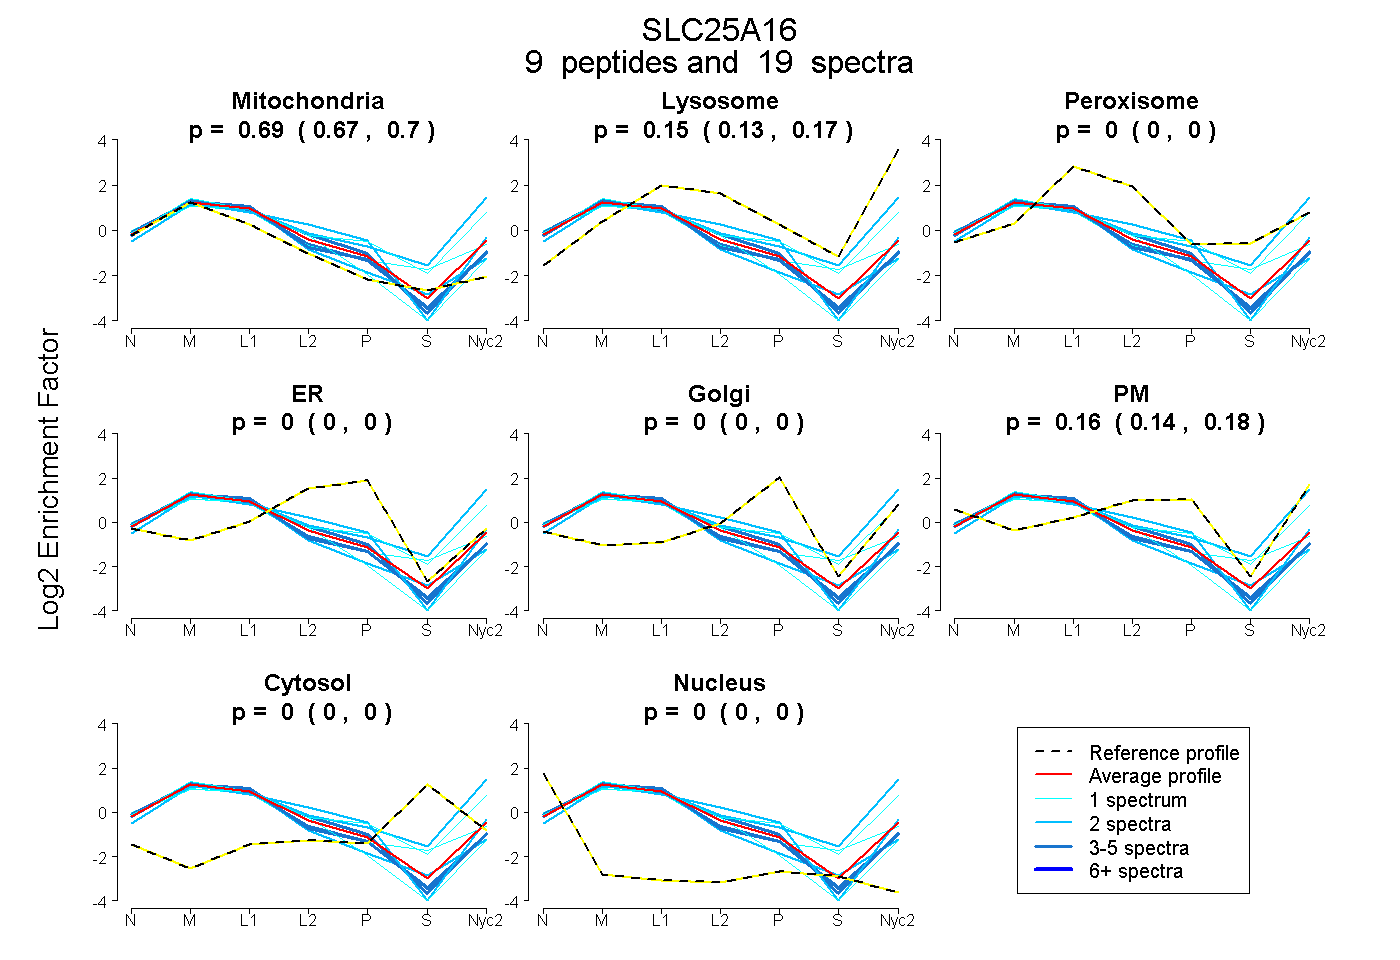
| Plot | Mito | Lyso | Perox | ER | Golgi | PM | Cytosol | Nucleus | |||||
| Expt A |
9 peptides |
19 spectra |
|
0.686 0.668 | 0.700 |
0.153 0.131 | 0.172 |
0.000 0.000 | 0.000 |
0.000 0.000 | 0.000 |
0.000 0.000 | 0.000 |
0.161 0.142 | 0.178 |
0.000 0.000 | 0.000 |
0.000 0.000 | 0.000 |
| 1 spectrum, QFFHLN | 0.859 | 0.049 | 0.000 | 0.000 | 0.000 | 0.092 | 0.000 | 0.000 | ||
| 3 spectra, GLSLNYIR | 0.782 | 0.054 | 0.000 | 0.000 | 0.000 | 0.164 | 0.000 | 0.000 | ||
| 2 spectra, SFLAGGIAGCCAK | 0.415 | 0.521 | 0.000 | 0.000 | 0.000 | 0.056 | 0.000 | 0.008 | ||
| 4 spectra, HLGVLSALR | 0.700 | 0.058 | 0.000 | 0.103 | 0.000 | 0.138 | 0.000 | 0.000 | ||
| 1 spectrum, YVYGHHGIR | 0.463 | 0.322 | 0.000 | 0.000 | 0.000 | 0.215 | 0.000 | 0.000 | ||
| 1 spectrum, EGGFLGFYR | 0.660 | 0.100 | 0.132 | 0.000 | 0.000 | 0.075 | 0.033 | 0.000 | ||
| 2 spectra, MQLGAVLPEFEK | 0.539 | 0.042 | 0.000 | 0.115 | 0.000 | 0.304 | 0.000 | 0.000 | ||
| 3 spectra, DFYWLR | 0.780 | 0.075 | 0.000 | 0.000 | 0.000 | 0.146 | 0.000 | 0.000 | ||
| 2 spectra, EGYLGLYK | 0.852 | 0.083 | 0.055 | 0.000 | 0.000 | 0.010 | 0.000 | 0.000 |
| Plot | Mito | Lyso or Perox | ER | Golgi | PM | Cytosol | Nucleus | ||||||
| Expt B |
4 peptides |
8 spectra |
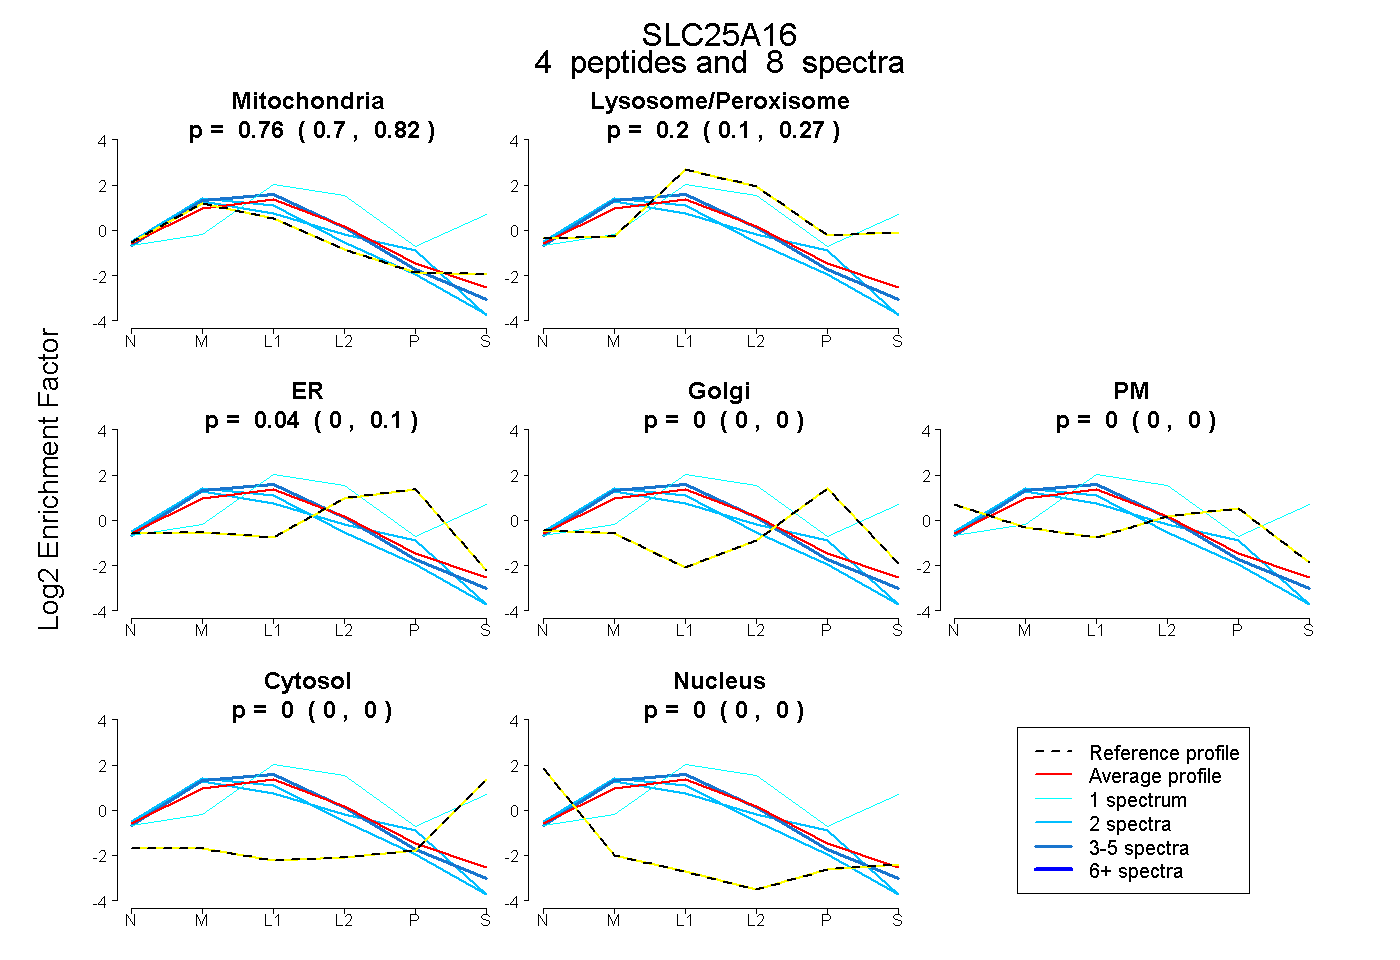 |
0.765 0.697 | 0.820 |
0.196 0.097 | 0.271 |
0.039 0.000 | 0.101 |
0.000 0.000 | 0.000 |
0.000 0.000 | 0.000 |
0.000 0.000 | 0.000 |
0.000 0.000 | 0.000 |
|||
| Plot | Lyso | Other | |||||||||||
| Expt C |
12 peptides |
51 spectra |
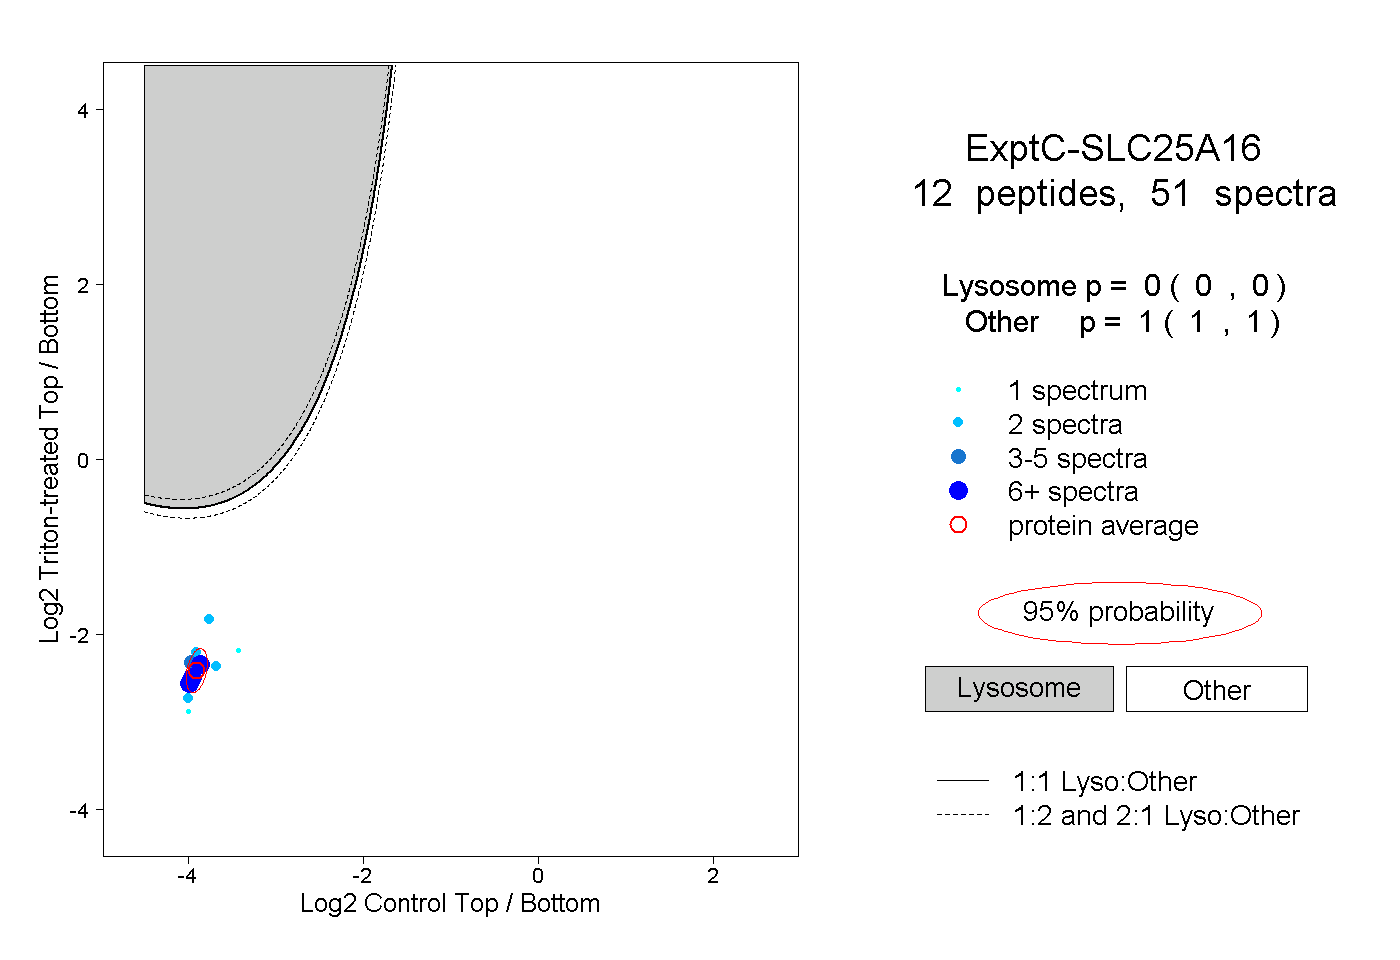 |
0.000 0.000 | 0.000 |
1.000 1.000 | 1.000 |
||||||||
| Plot | Lyso | Other | |||||||||||
| Expt D |
3 peptides |
5 spectra |
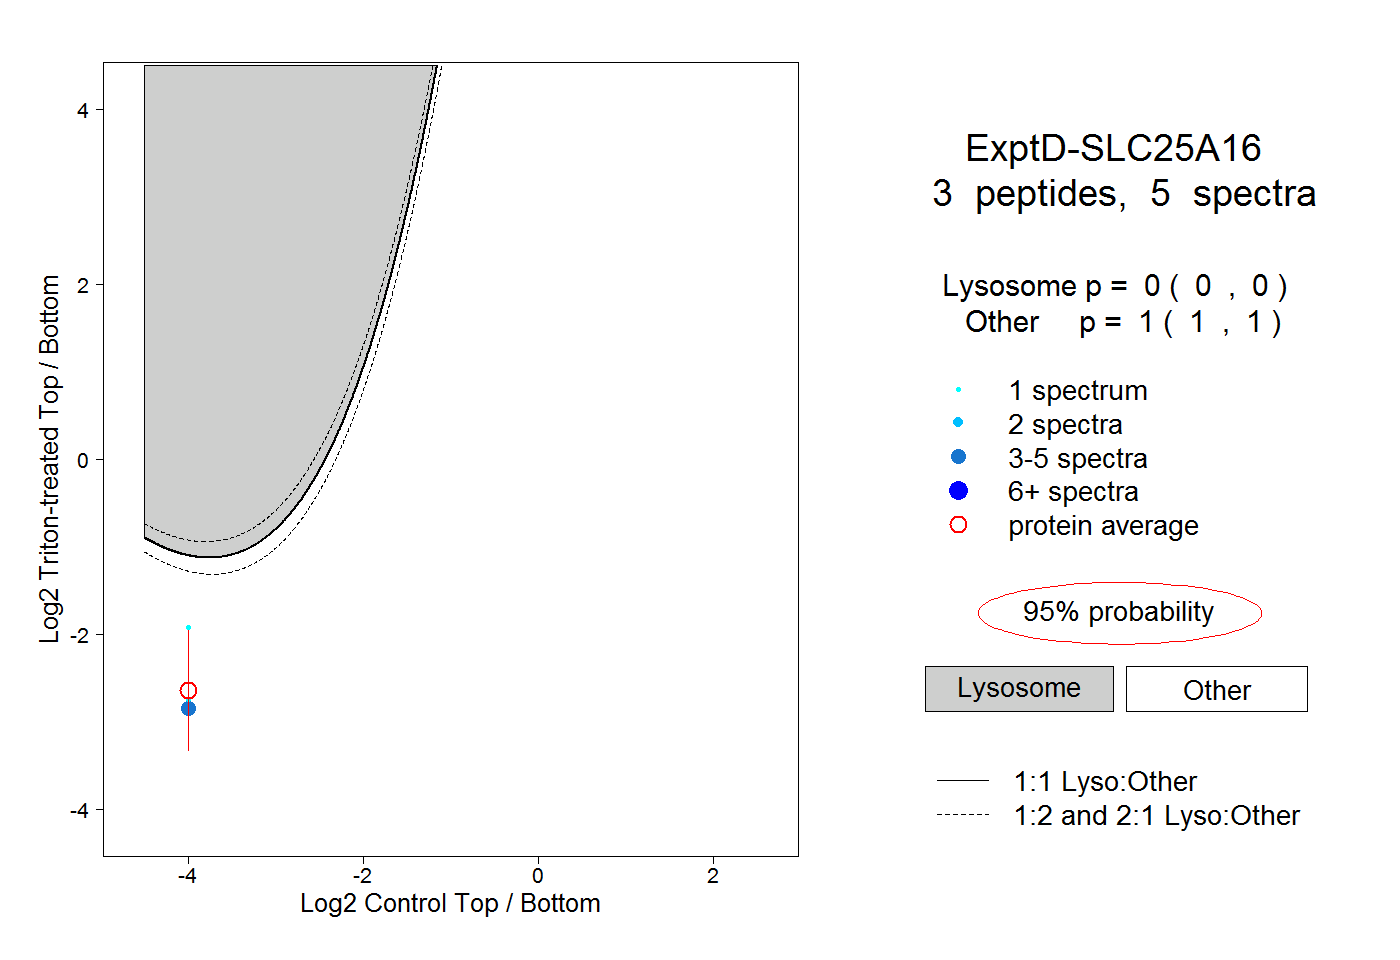 |
0.000 0.000 | 0.000 |
1.000 1.000 | 1.000 |