 8
8peptides
spectra
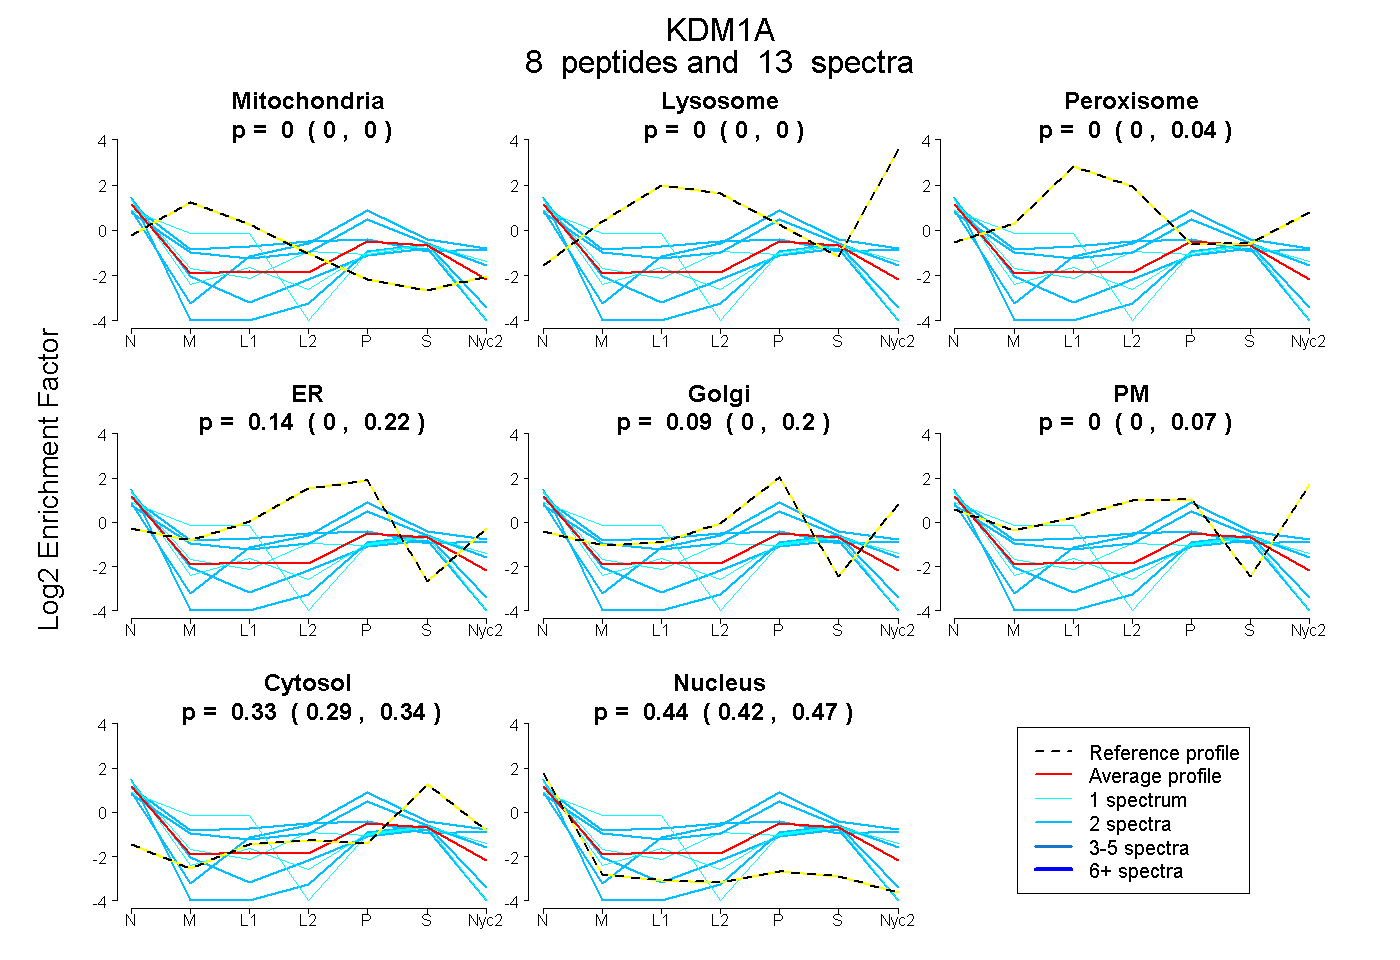
0.000 | 0.000
0.000 | 0.000
0.000 | 0.042
0.000 | 0.217
0.000 | 0.200
0.000 | 0.065
0.292 | 0.337
0.416 | 0.465
| Plot | Mito | Lyso | Perox | ER | Golgi | PM | Cytosol | Nucleus | |||||
| Expt A |
8 peptides |
13 spectra |
|
0.000 0.000 | 0.000 |
0.000 0.000 | 0.000 |
0.000 0.000 | 0.042 |
0.140 0.000 | 0.217 |
0.094 0.000 | 0.200 |
0.000 0.000 | 0.065 |
0.325 0.292 | 0.337 |
0.440 0.416 | 0.465 |