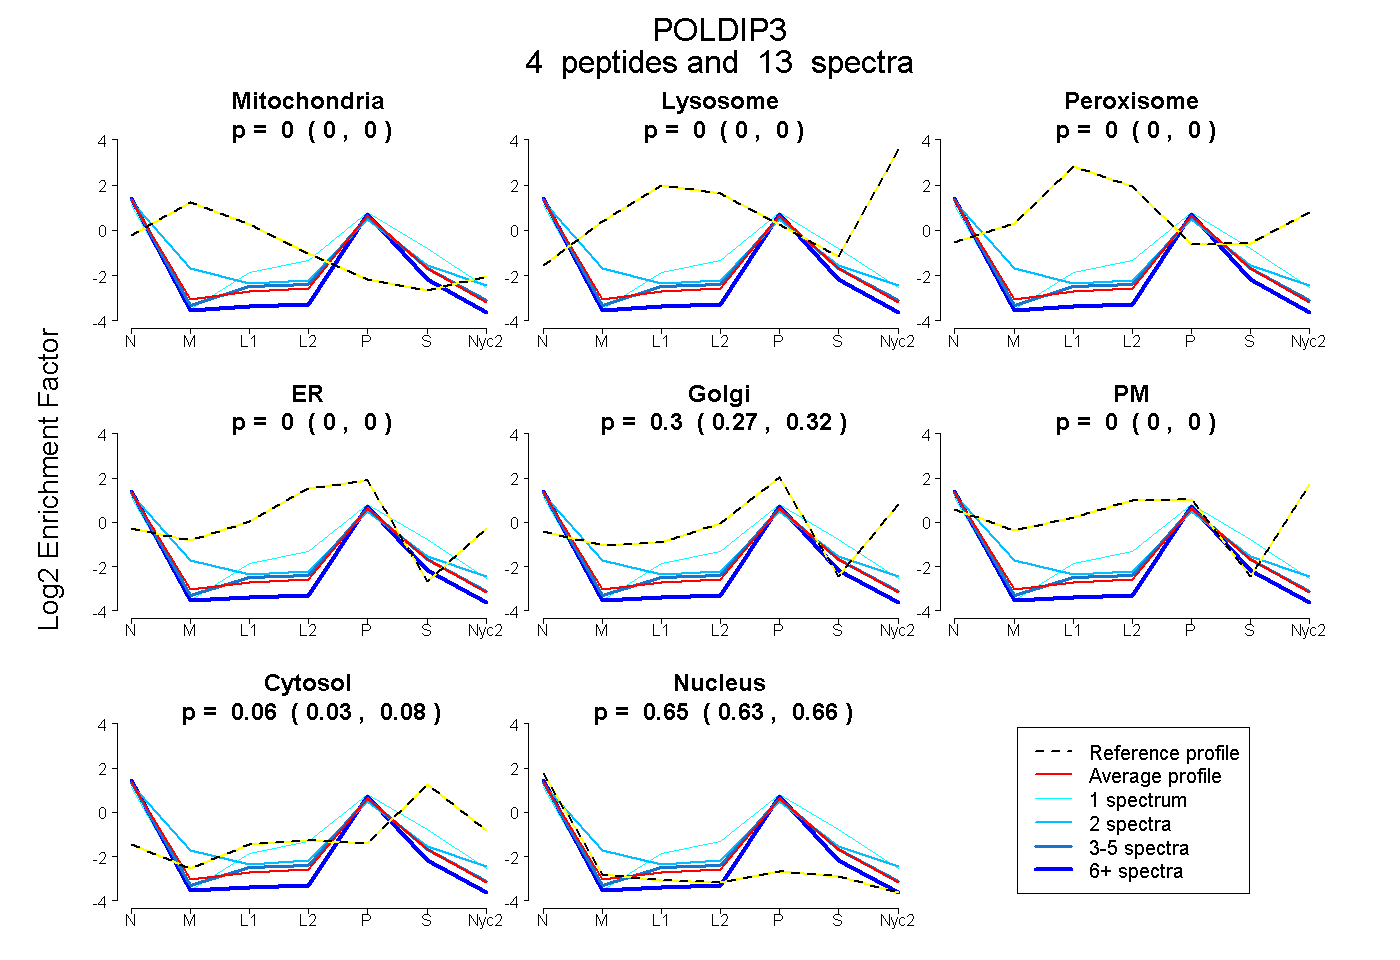
 4
4peptides
spectra
0.000 | 0.000
0.000 | 0.000
0.000 | 0.000
0.000 | 0.000
0.273 | 0.316
0.000 | 0.000
0.031 | 0.078
0.626 | 0.664
| Plot | Mito | Lyso | Perox | ER | Golgi | PM | Cytosol | Nucleus | |||||
| Expt A |
4 peptides |
13 spectra |
|
0.000 0.000 | 0.000 |
0.000 0.000 | 0.000 |
0.000 0.000 | 0.000 |
0.000 0.000 | 0.000 |
0.297 0.273 | 0.316 |
0.000 0.000 | 0.000 |
0.056 0.031 | 0.078 |
0.647 0.626 | 0.664 |
| 6 spectra, LSVRPGIGGVR | 0.000 | 0.000 | 0.000 | 0.000 | 0.226 | 0.000 | 0.000 | 0.774 | ||
| 4 spectra, VGIQHSLLSQPAR | 0.000 | 0.000 | 0.000 | 0.000 | 0.296 | 0.000 | 0.073 | 0.631 | ||
| 2 spectra, QQNTVPQKPR | 0.000 | 0.000 | 0.000 | 0.000 | 0.402 | 0.000 | 0.068 | 0.530 | ||
| 1 spectrum, ALTNMSR | 0.000 | 0.000 | 0.000 | 0.242 | 0.065 | 0.000 | 0.281 | 0.412 |
| Plot | Mito | Lyso or Perox | ER | Golgi | PM | Cytosol | Nucleus | ||||||
| Expt B |
1 peptide |
2 spectra |
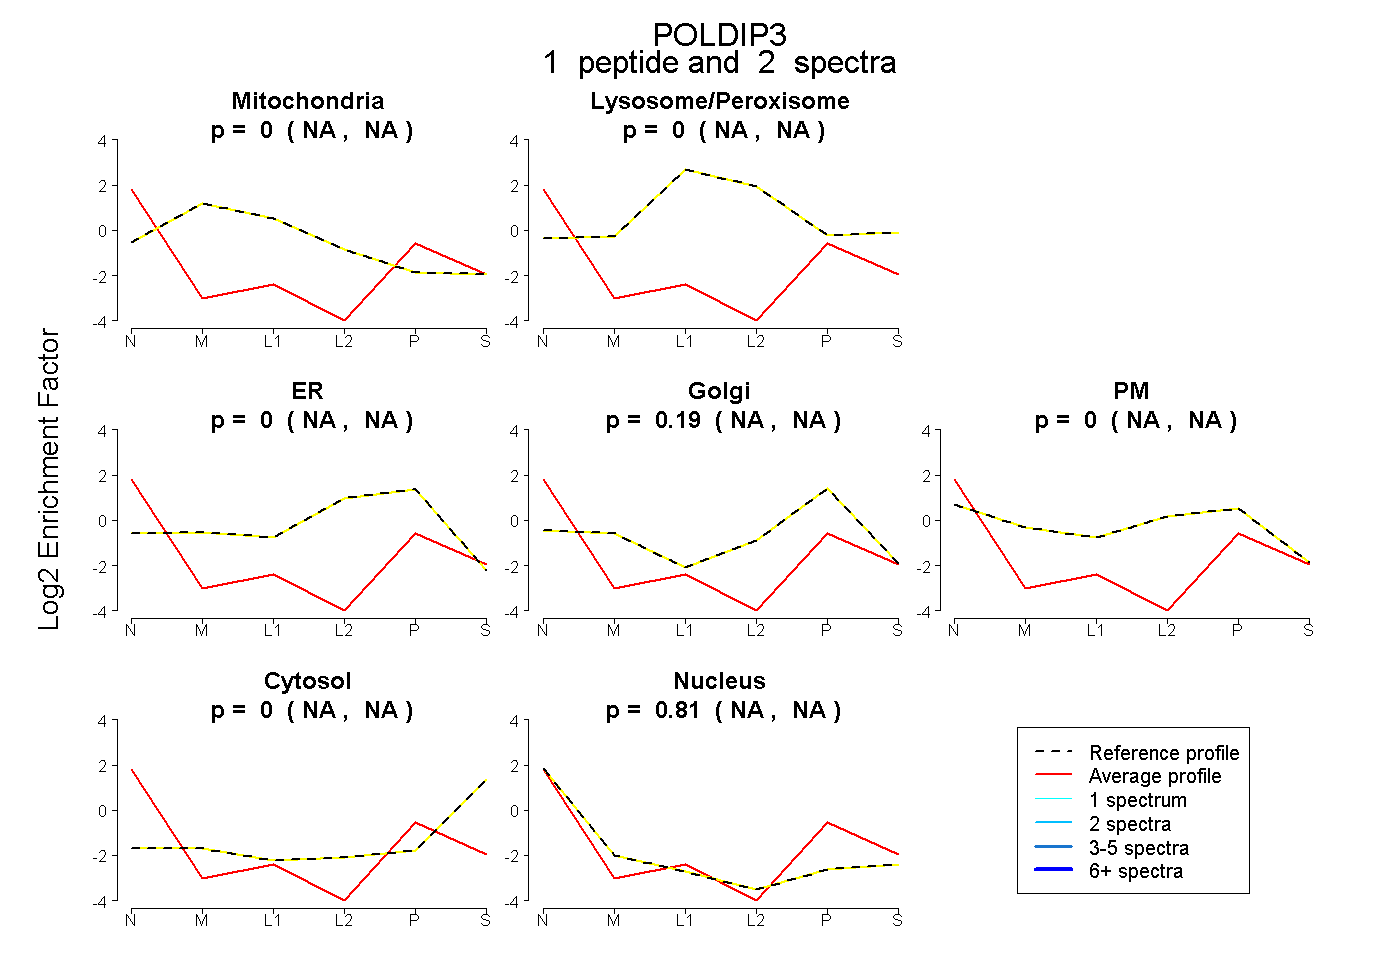 |
0.000 NA | NA |
0.000 NA | NA |
0.000 NA | NA |
0.194 NA | NA |
0.000 NA | NA |
0.000 NA | NA |
0.806 NA | NA |