 11
11peptides
spectra
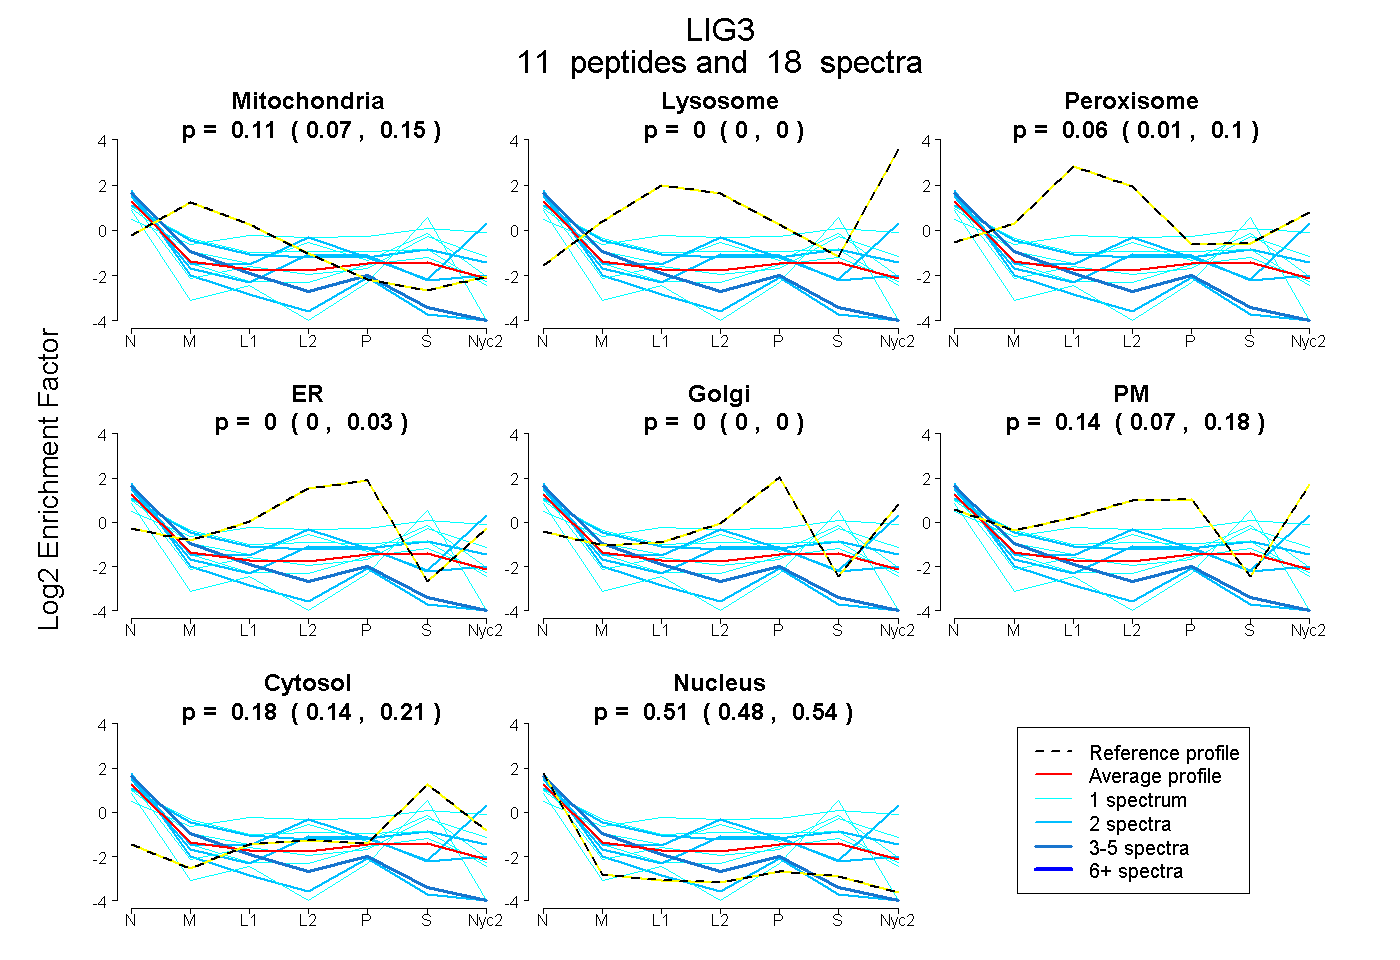
0.068 | 0.145
0.000 | 0.000
0.008 | 0.104
0.000 | 0.026
0.000 | 0.000
0.070 | 0.179
0.136 | 0.205
0.483 | 0.544
| Plot | Mito | Lyso | Perox | ER | Golgi | PM | Cytosol | Nucleus | |||||
| Expt A |
11 peptides |
18 spectra |
|
0.110 0.068 | 0.145 |
0.000 0.000 | 0.000 |
0.060 0.008 | 0.104 |
0.000 0.000 | 0.026 |
0.000 0.000 | 0.000 |
0.141 0.070 | 0.179 |
0.175 0.136 | 0.205 |
0.514 0.483 | 0.544 |
| 1 spectrum, SIEYAMK | 0.280 | 0.000 | 0.111 | 0.127 | 0.000 | 0.000 | 0.175 | 0.306 | ||
| 1 spectrum, EGLEGLVLK | 0.000 | 0.000 | 0.000 | 0.000 | 0.000 | 0.000 | 0.371 | 0.629 | ||
| 2 spectra, EDEQQQALQDIASR | 0.000 | 0.000 | 0.000 | 0.145 | 0.000 | 0.215 | 0.042 | 0.597 | ||
| 2 spectra, DLEQGDVSETIR | 0.067 | 0.000 | 0.000 | 0.000 | 0.000 | 0.000 | 0.000 | 0.933 | ||
| 1 spectrum, CTANDLK | 0.054 | 0.000 | 0.229 | 0.041 | 0.000 | 0.000 | 0.314 | 0.363 | ||
| 4 spectra, TQIIHDFLQK | 0.317 | 0.000 | 0.000 | 0.000 | 0.000 | 0.000 | 0.000 | 0.683 | ||
| 2 spectra, SLKPVLPHK | 0.000 | 0.066 | 0.000 | 0.000 | 0.000 | 0.515 | 0.015 | 0.404 | ||
| 1 spectrum, ASDLADMINR | 0.081 | 0.000 | 0.000 | 0.000 | 0.000 | 0.128 | 0.228 | 0.563 | ||
| 2 spectra, FLHDNMVEIR | 0.243 | 0.000 | 0.073 | 0.000 | 0.000 | 0.181 | 0.224 | 0.280 | ||
| 1 spectrum, SVYNLNDK | 0.000 | 0.000 | 0.041 | 0.000 | 0.000 | 0.131 | 0.419 | 0.409 | ||
| 1 spectrum, SATNLPQLK | 0.030 | 0.000 | 0.198 | 0.000 | 0.000 | 0.312 | 0.389 | 0.071 |
| Plot | Mito | Lyso or Perox | ER | Golgi | PM | Cytosol | Nucleus | ||||||
| Expt B |
1 peptide |
1 spectrum |
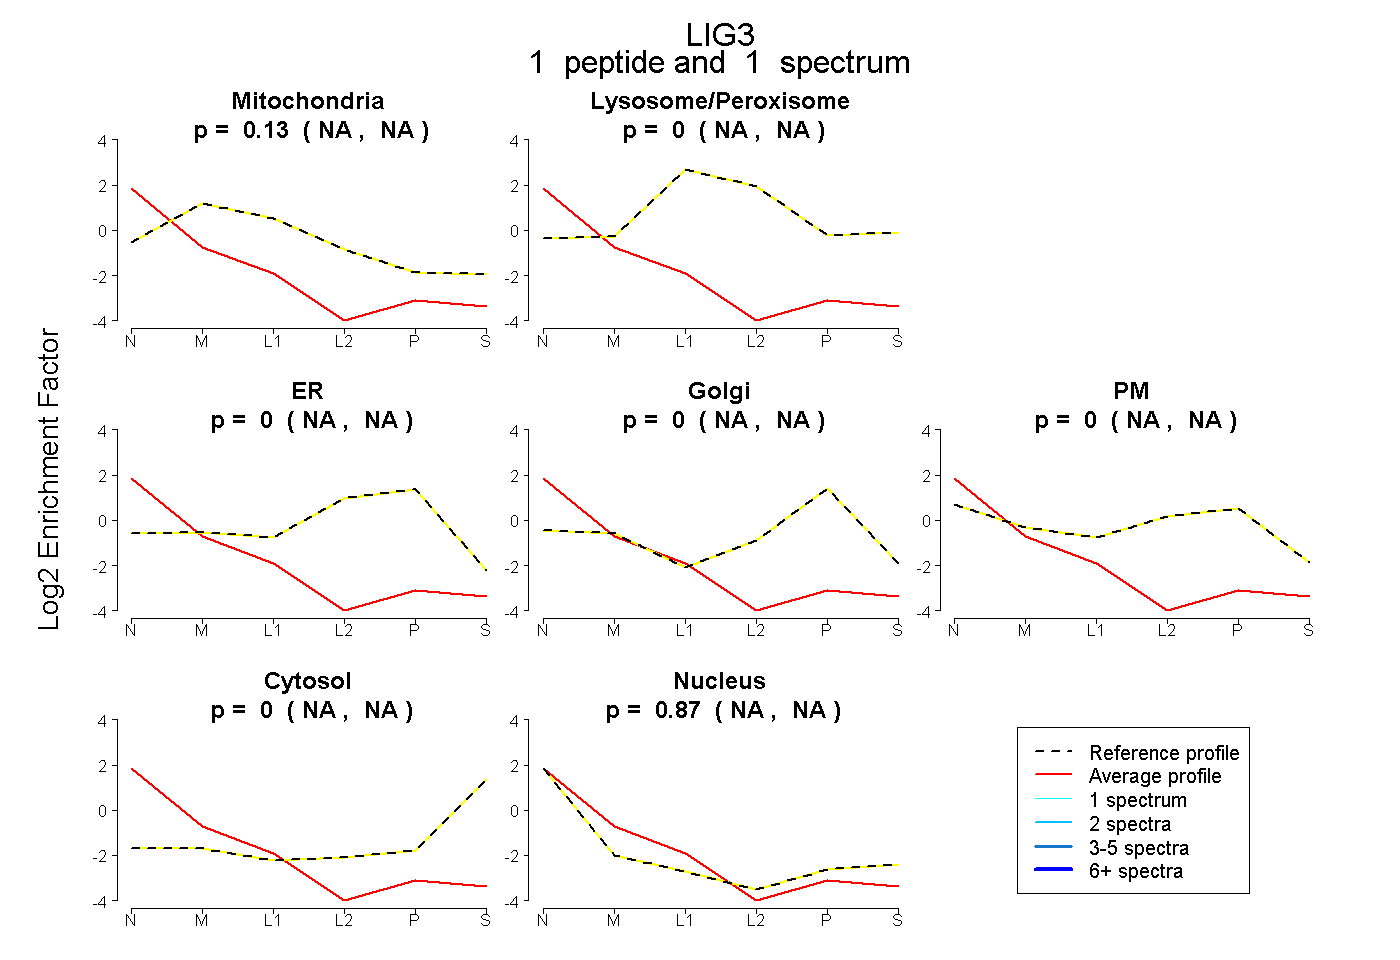 |
0.127 NA | NA |
0.000 NA | NA |
0.000 NA | NA |
0.000 NA | NA |
0.000 NA | NA |
0.000 NA | NA |
0.873 NA | NA |
|||
| Plot | Lyso | Other | |||||||||||
| Expt C |
1 peptide |
4 spectra |
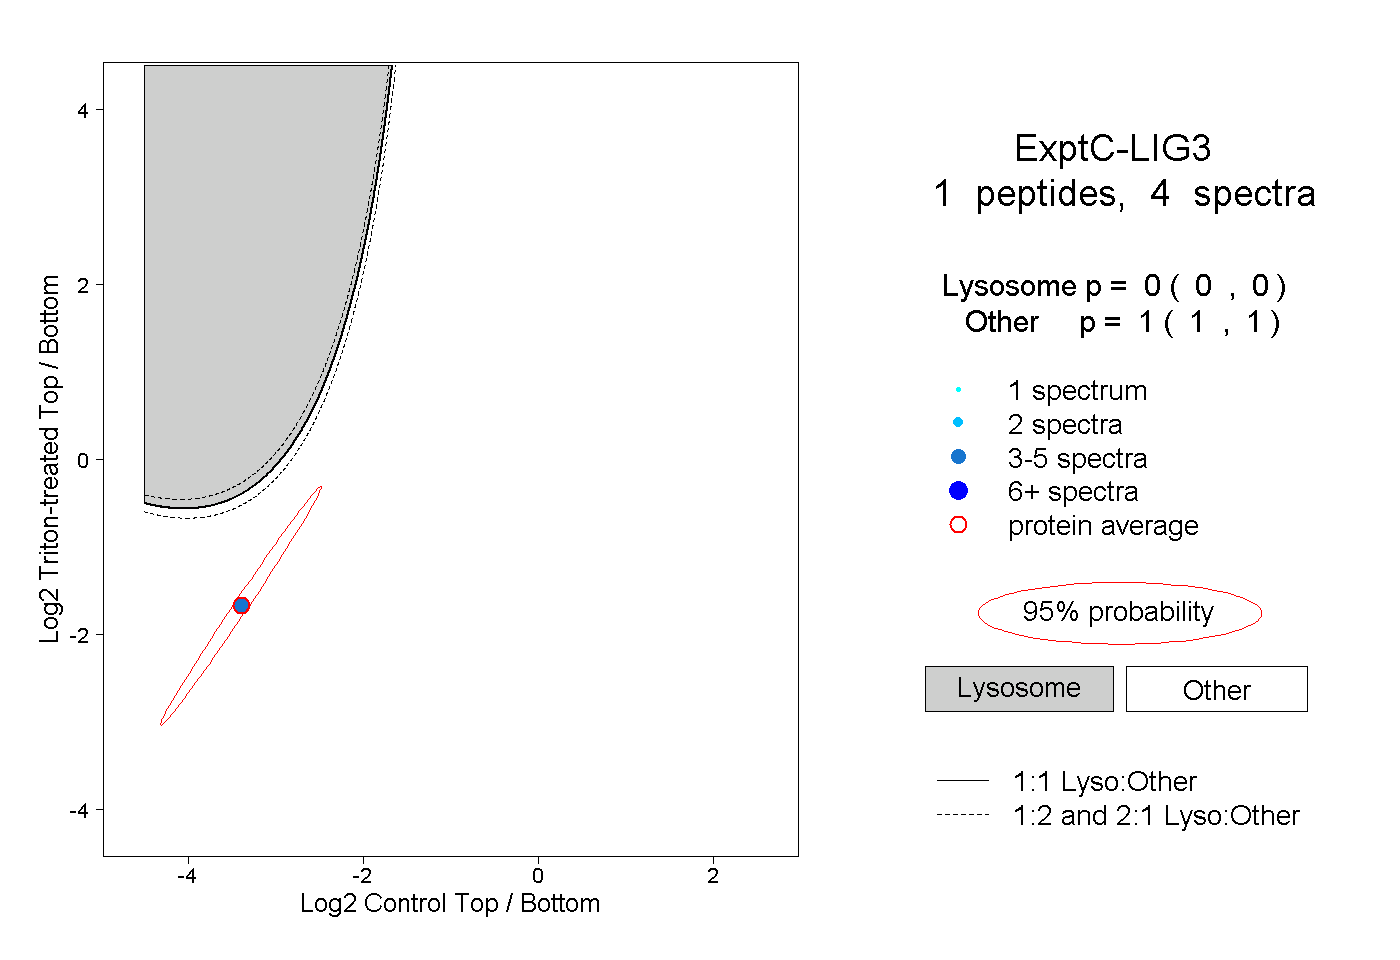 |
0.000 0.000 | 0.000 |
1.000 1.000 | 1.000 |
||||||||
| Plot | Lyso | Other | |||||||||||
| Expt D |
1 peptide |
1 spectrum |
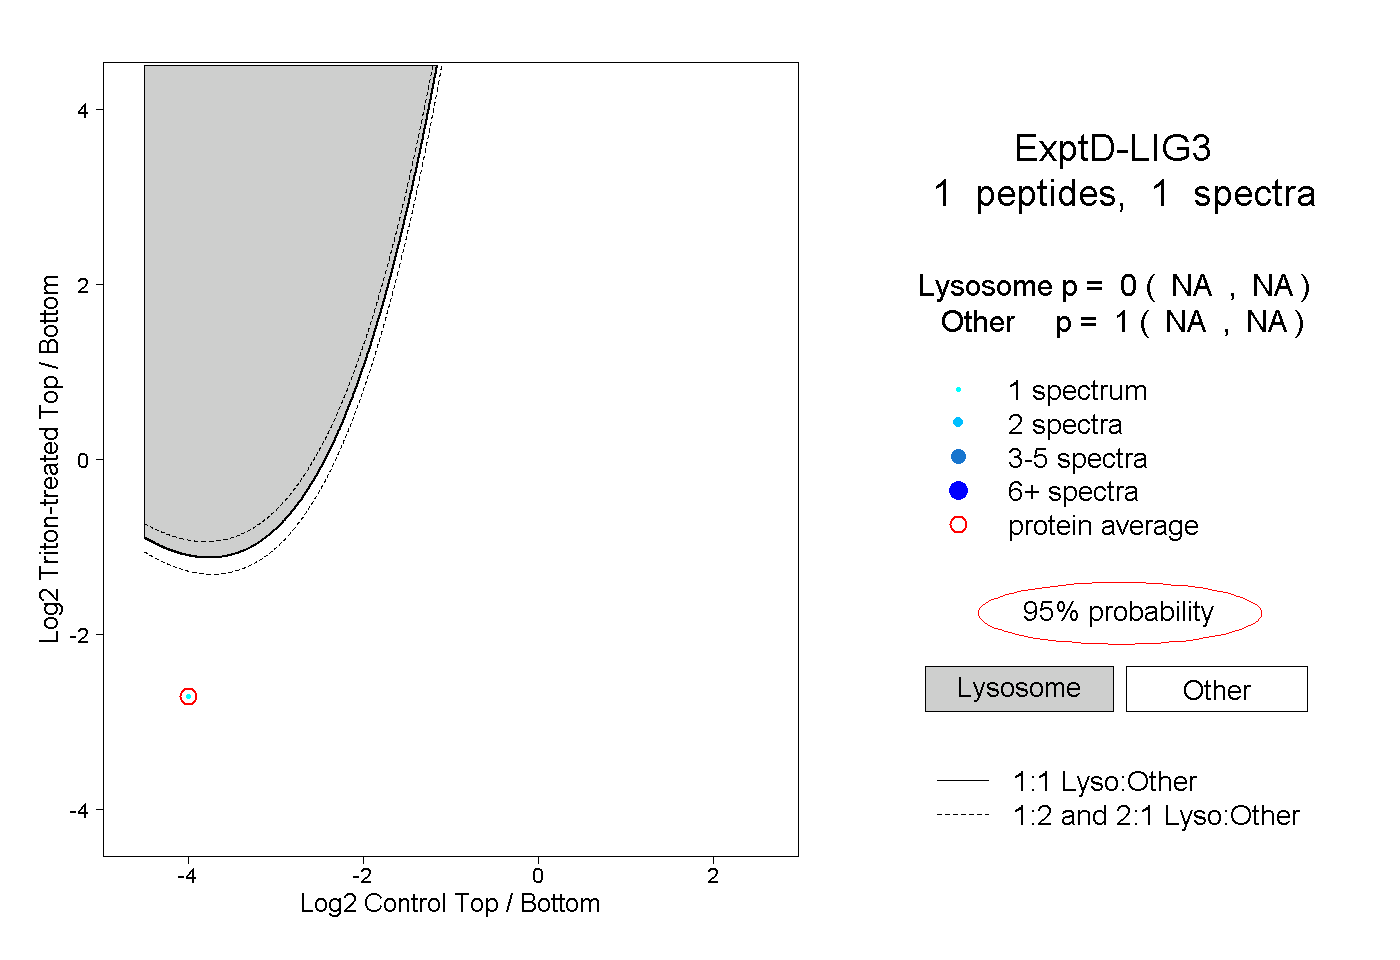 |
0.000 NA | NA |
1.000 NA | NA |