 20
20peptides
spectra
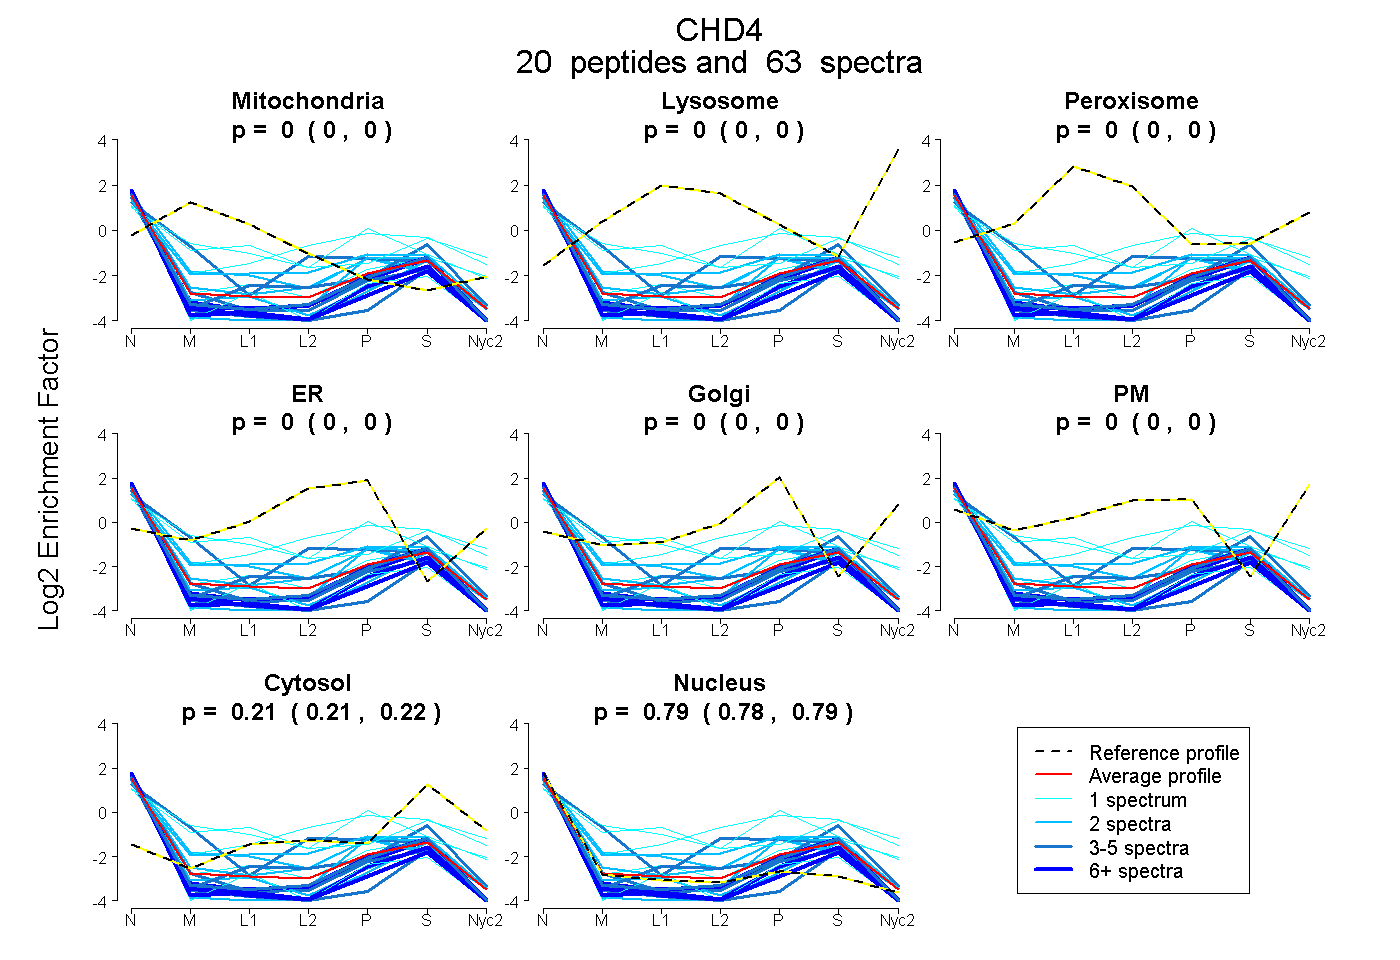
0.000 | 0.000
0.000 | 0.000
0.000 | 0.000
0.000 | 0.000
0.000 | 0.000
0.000 | 0.000
0.206 | 0.216
0.784 | 0.793
2peptides
spectra
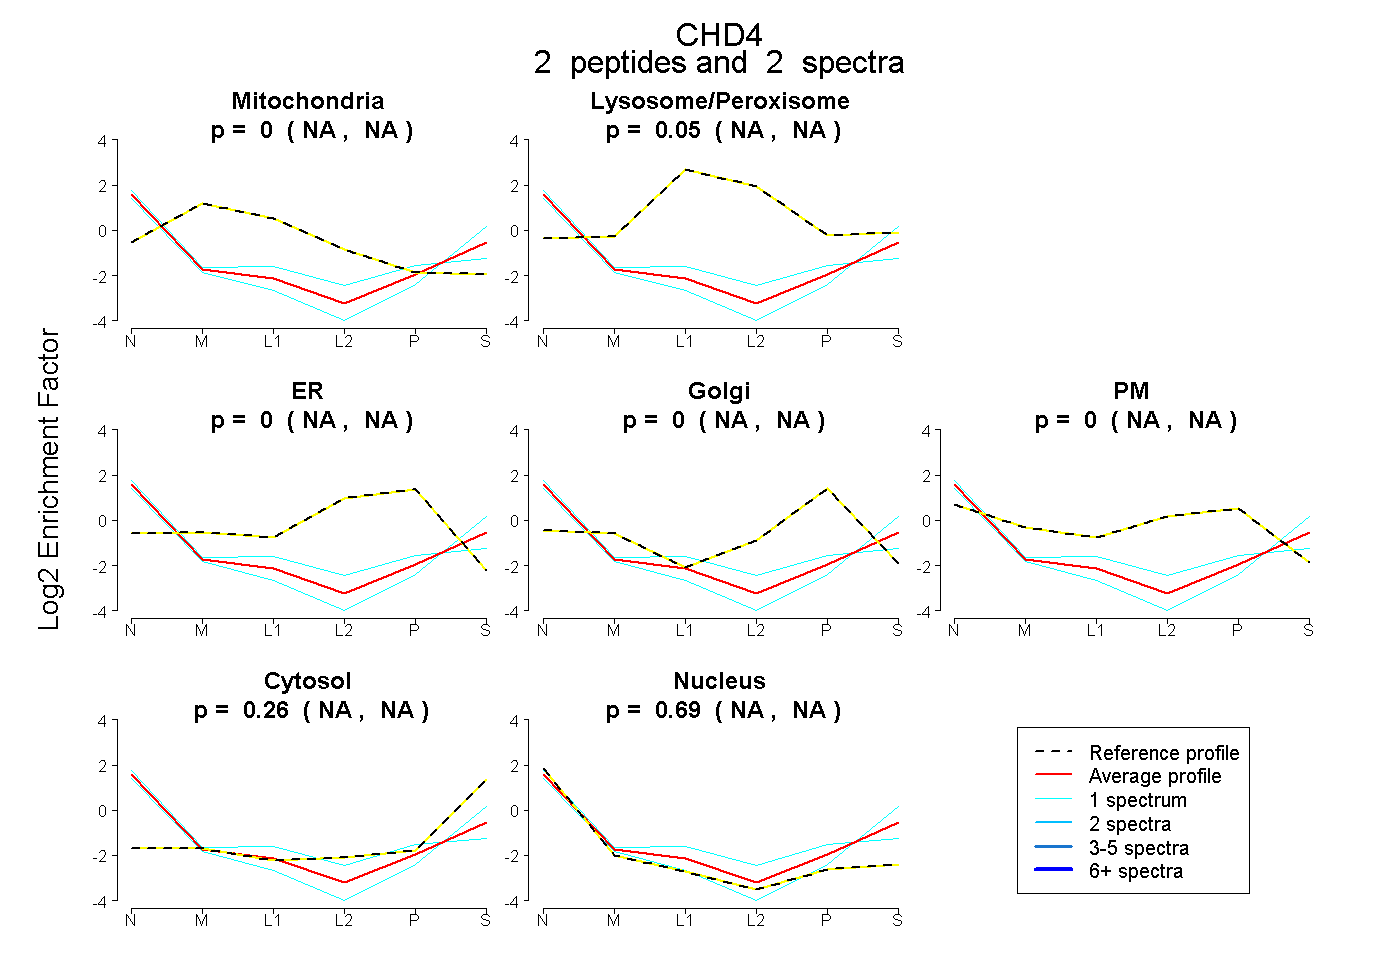
NA | NA
NA | NA
NA | NA
NA | NA
NA | NA
NA | NA
NA | NA
| Plot | Mito | Lyso | Perox | ER | Golgi | PM | Cytosol | Nucleus | |||||
| Expt A |
20 peptides |
63 spectra |
|
0.000 0.000 | 0.000 |
0.000 0.000 | 0.000 |
0.000 0.000 | 0.000 |
0.000 0.000 | 0.000 |
0.000 0.000 | 0.000 |
0.000 0.000 | 0.000 |
0.211 0.206 | 0.216 |
0.789 0.784 | 0.793 |
||
| Plot | Mito | Lyso or Perox | ER | Golgi | PM | Cytosol | Nucleus | ||||||
| Expt B |
2 peptides |
2 spectra |
|
0.000 NA | NA |
0.049 NA | NA |
0.000 NA | NA |
0.000 NA | NA |
0.000 NA | NA |
0.259 NA | NA |
0.692 NA | NA |
| 1 spectrum, DLSDEK | 0.000 | 0.151 | 0.000 | 0.000 | 0.098 | 0.058 | 0.694 | |||
| 1 spectrum, NFEALNAR | 0.000 | 0.000 | 0.000 | 0.000 | 0.000 | 0.360 | 0.640 |
| Plot | Lyso | Other | |||||||||||
| Expt C |
1 peptide |
2 spectra |
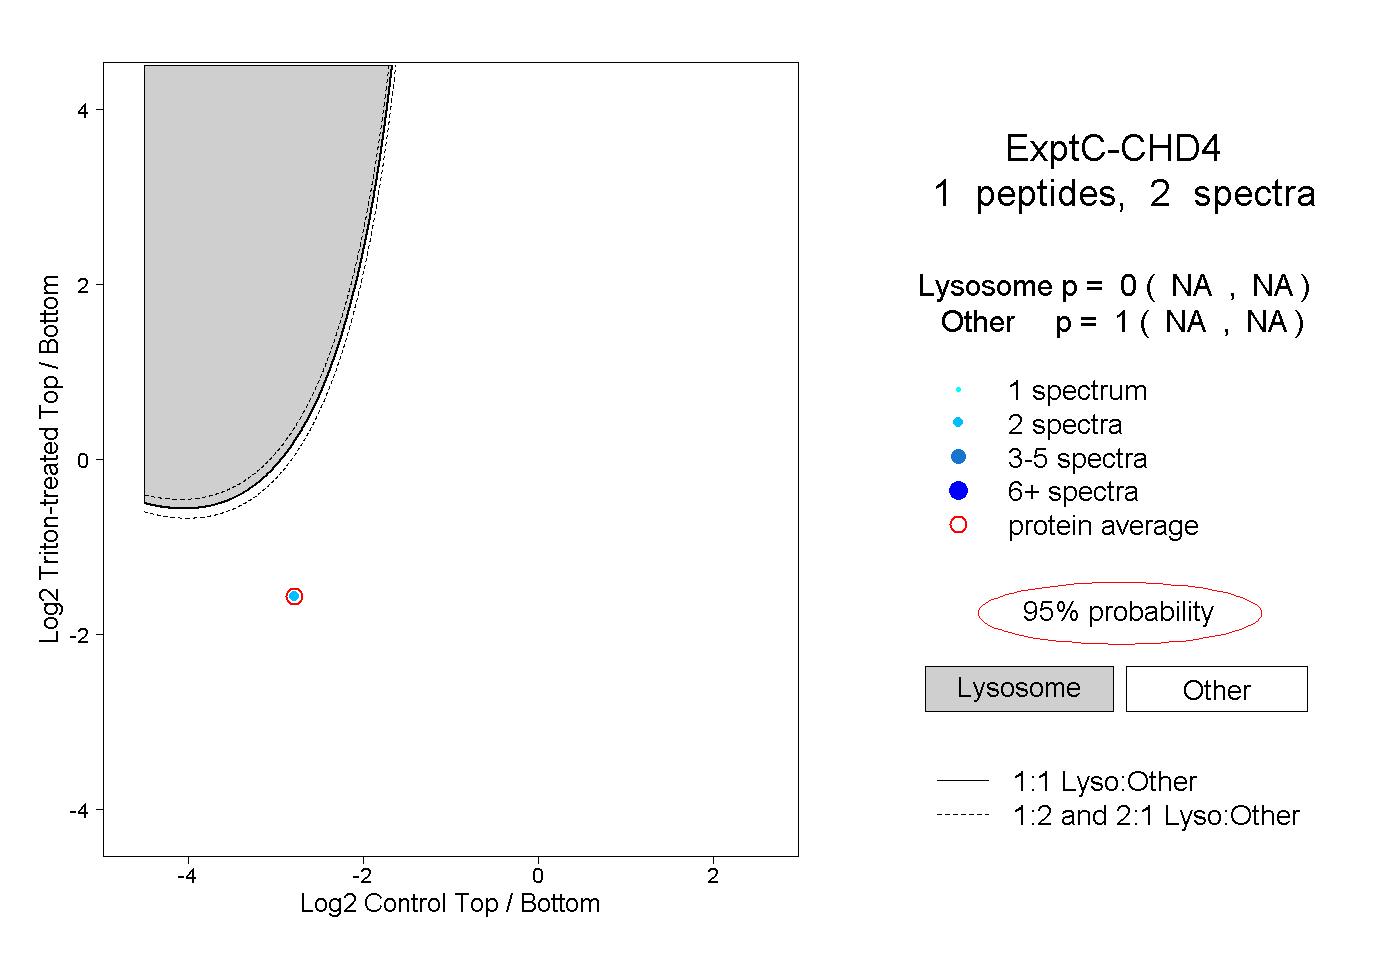 |
0.000 NA | NA |
1.000 NA | NA |