 4
4peptides
spectra
0.000 | 0.000
0.000 | 0.005
0.000 | 0.081
0.000 | 0.117
0.000 | 0.172
0.000 | 0.098
0.751 | 0.833
0.000 | 0.000
1peptide
spectrum
NA | NA
NA | NA
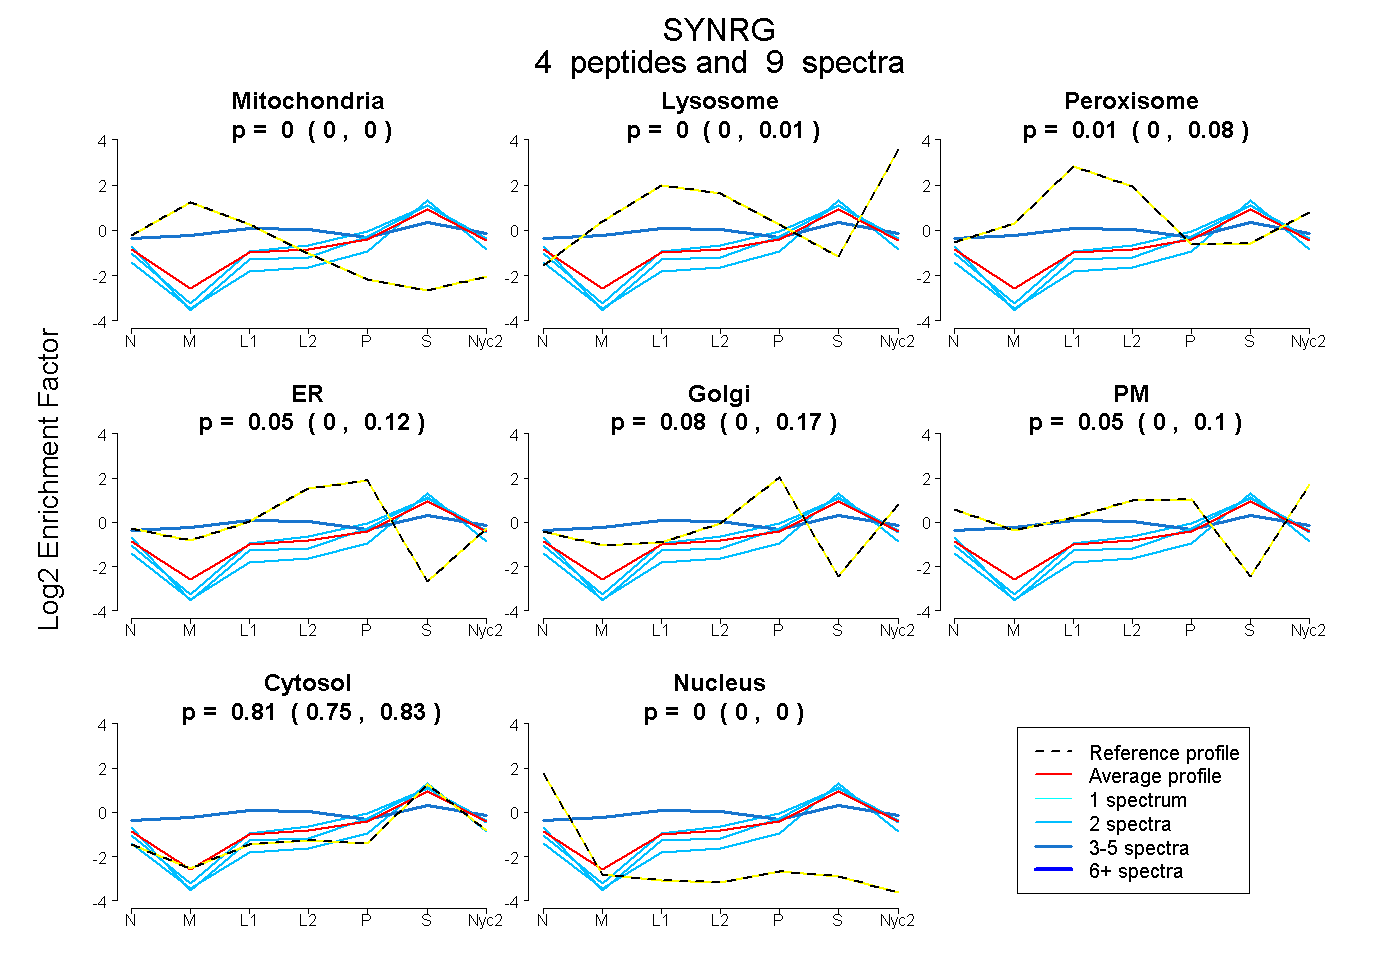
| Plot | Mito | Lyso | Perox | ER | Golgi | PM | Cytosol | Nucleus | |||||
| Expt A |
4 peptides |
9 spectra |
|
0.000 0.000 | 0.000 |
0.000 0.000 | 0.005 |
0.008 0.000 | 0.081 |
0.053 0.000 | 0.117 |
0.078 0.000 | 0.172 |
0.054 0.000 | 0.098 |
0.807 0.751 | 0.833 |
0.000 0.000 | 0.000 |
||
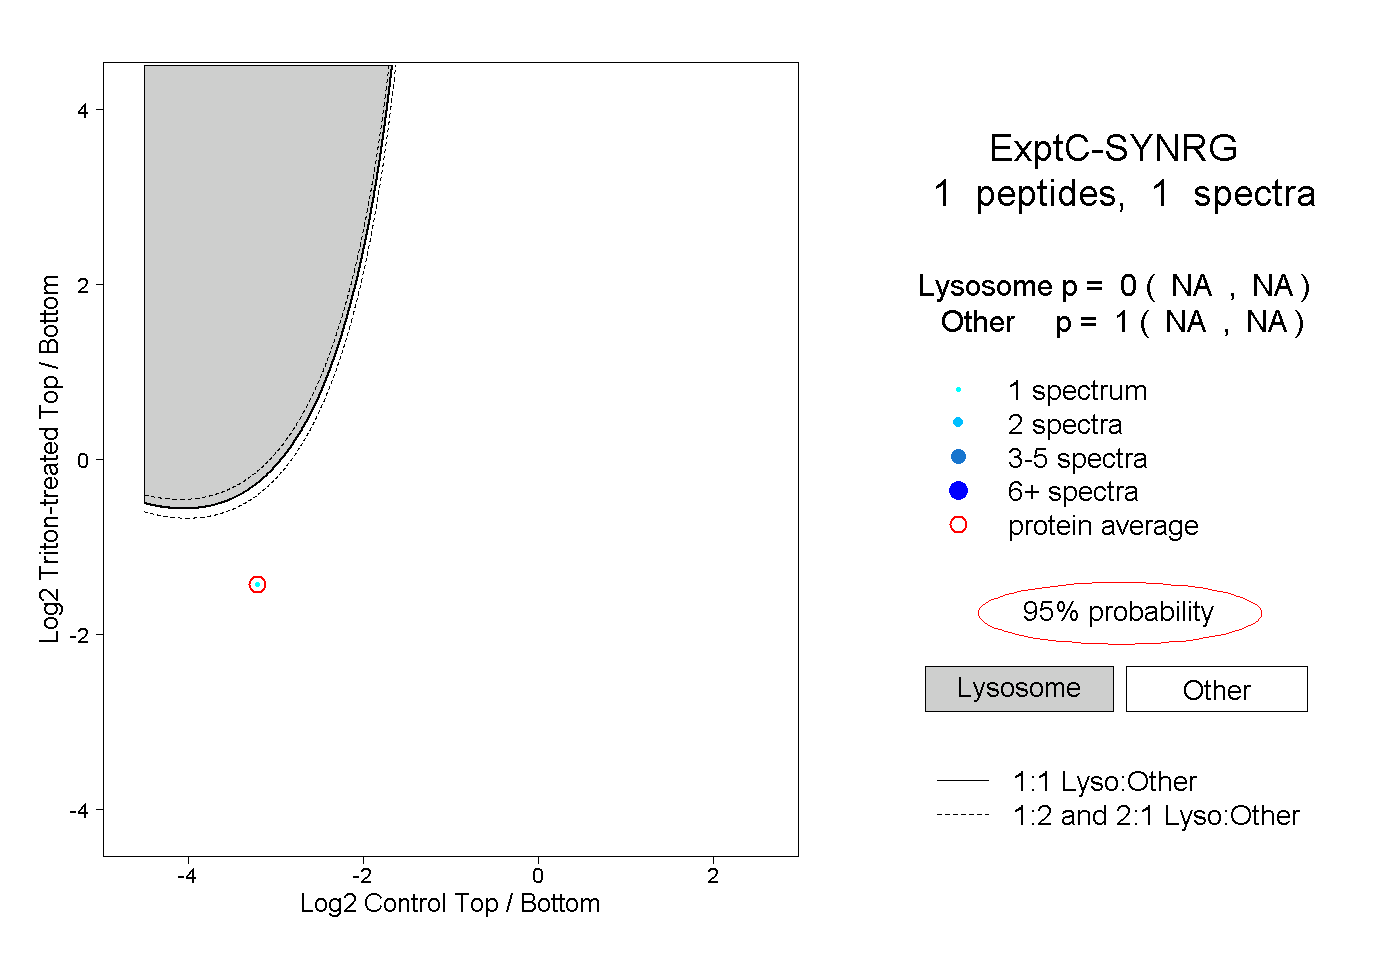
| Plot | Lyso | Other | |||||||||||
| Expt C |
1 peptide |
1 spectrum |
|
0.000 NA | NA |
1.000 NA | NA |