 2
2peptides
spectra
NA | NA
NA | NA
NA | NA
NA | NA
NA | NA
NA | NA
NA | NA
NA | NA
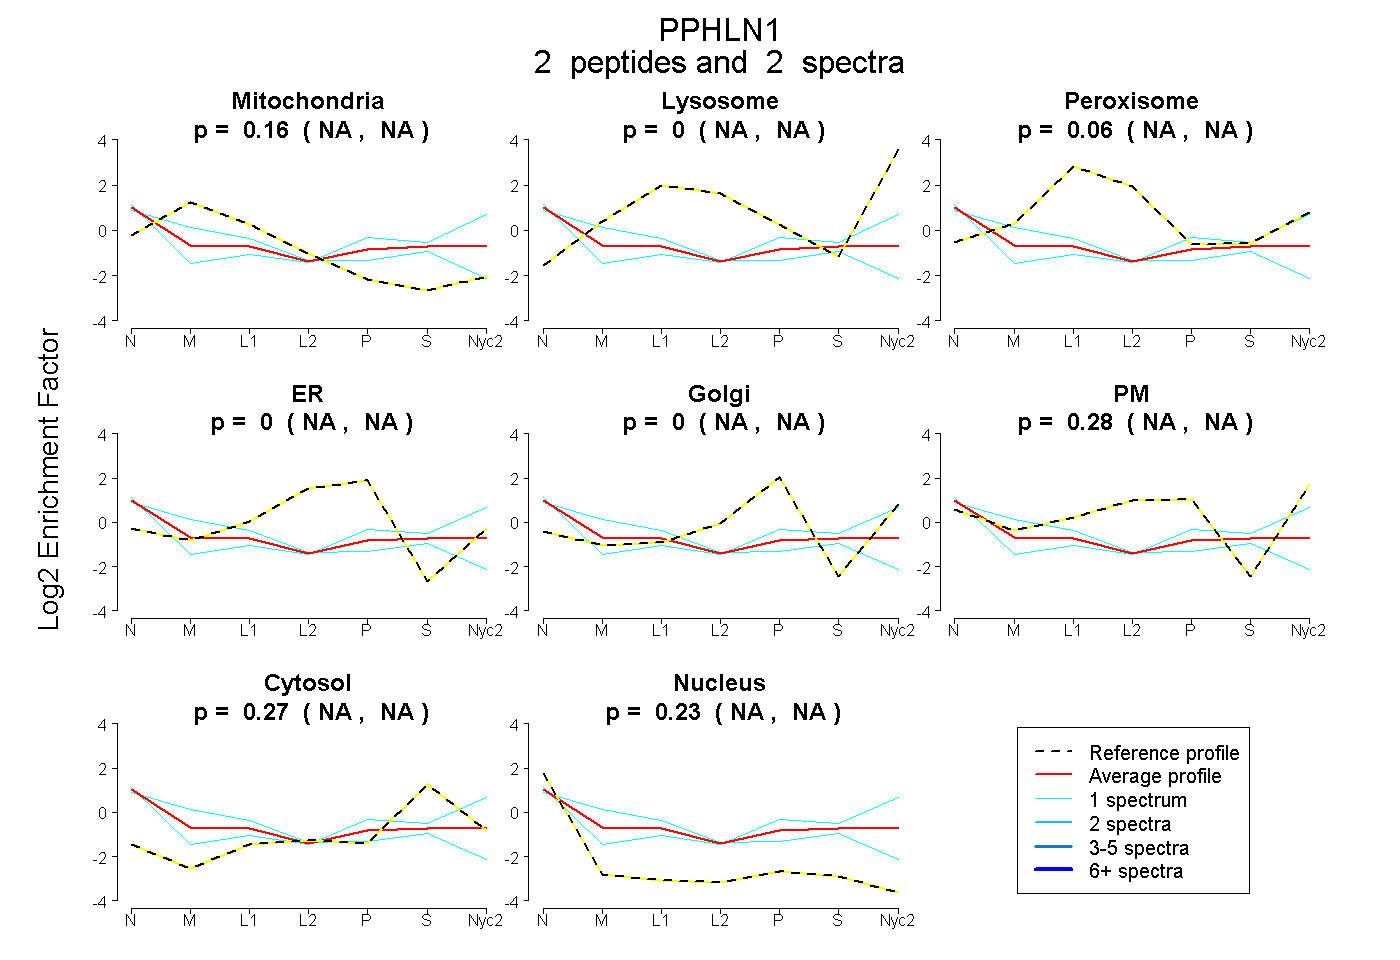
| Plot | Mito | Lyso | Perox | ER | Golgi | PM | Cytosol | Nucleus | |||||
| Expt A |
2 peptides |
2 spectra |
|
0.159 NA | NA |
0.000 NA | NA |
0.061 NA | NA |
0.000 NA | NA |
0.000 NA | NA |
0.283 NA | NA |
0.272 NA | NA |
0.225 NA | NA |
| 1 spectrum, ELAEAESK | 0.441 | 0.000 | 0.166 | 0.000 | 0.000 | 0.000 | 0.155 | 0.239 | ||
| 1 spectrum, VGASYK | 0.000 | 0.000 | 0.000 | 0.000 | 0.000 | 0.470 | 0.358 | 0.173 |