 15
15peptides
spectra
0.000 | 0.000
0.000 | 0.000
0.138 | 0.168
0.289 | 0.308
0.000 | 0.000
0.000 | 0.000
0.465 | 0.491
0.056 | 0.075
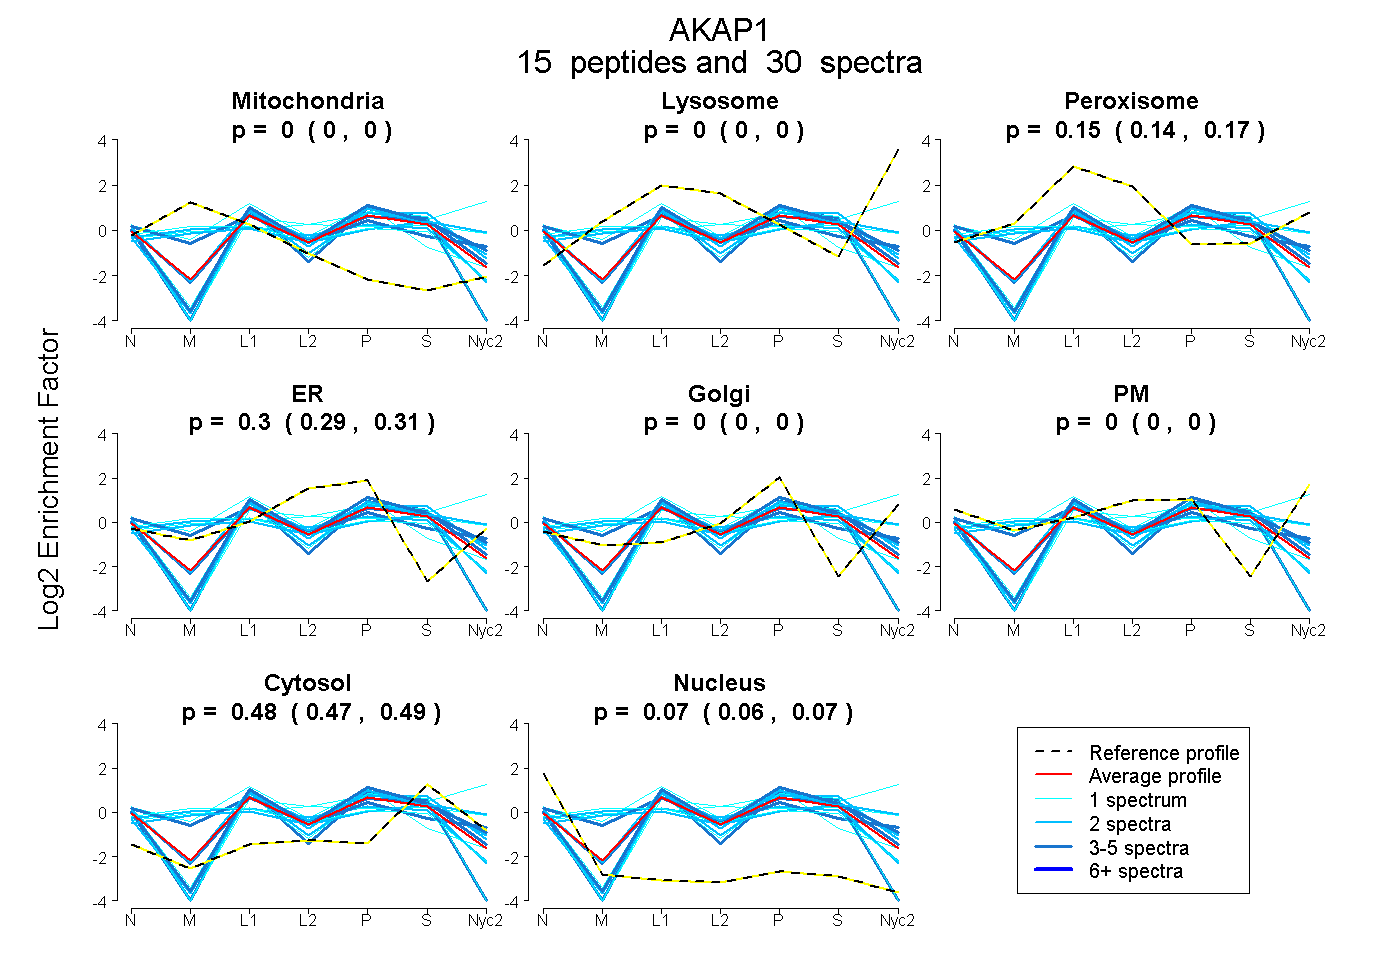
| Plot | Mito | Lyso | Perox | ER | Golgi | PM | Cytosol | Nucleus | |||||
| Expt A |
15 peptides |
30 spectra |
|
0.000 0.000 | 0.000 |
0.000 0.000 | 0.000 |
0.154 0.138 | 0.168 |
0.300 0.289 | 0.308 |
0.000 0.000 | 0.000 |
0.000 0.000 | 0.000 |
0.480 0.465 | 0.491 |
0.067 0.056 | 0.075 |
| 2 spectra, YVDYGGYK | 0.095 | 0.000 | 0.299 | 0.000 | 0.209 | 0.000 | 0.397 | 0.000 | ||
| 4 spectra, QSLDGASNPR | 0.000 | 0.000 | 0.162 | 0.287 | 0.000 | 0.000 | 0.506 | 0.045 | ||
| 1 spectrum, SGPPQVDELLK | 0.000 | 0.000 | 0.000 | 0.233 | 0.000 | 0.000 | 0.569 | 0.197 | ||
| 2 spectra, VGPAIEDR | 0.000 | 0.000 | 0.140 | 0.319 | 0.000 | 0.000 | 0.443 | 0.098 | ||
| 2 spectra, SESSGNLPSIVDTR | 0.000 | 0.000 | 0.045 | 0.264 | 0.000 | 0.000 | 0.690 | 0.000 | ||
| 1 spectrum, LEDSCTETISSSGDK | 0.000 | 0.079 | 0.000 | 0.000 | 0.000 | 0.401 | 0.520 | 0.000 | ||
| 3 spectra, VVLSLMGDEAK | 0.000 | 0.000 | 0.065 | 0.367 | 0.000 | 0.000 | 0.568 | 0.000 | ||
| 1 spectrum, QTSGAK | 0.062 | 0.000 | 0.368 | 0.002 | 0.240 | 0.000 | 0.329 | 0.000 | ||
| 4 spectra, SMDRPLTDPPALPR | 0.051 | 0.000 | 0.372 | 0.000 | 0.254 | 0.000 | 0.228 | 0.095 | ||
| 1 spectrum, AIQFR | 0.156 | 0.000 | 0.219 | 0.412 | 0.000 | 0.000 | 0.160 | 0.053 | ||
| 3 spectra, GWLSQCAASGENAR | 0.000 | 0.000 | 0.000 | 0.245 | 0.000 | 0.000 | 0.557 | 0.198 | ||
| 2 spectra, ALNLIGK | 0.299 | 0.000 | 0.098 | 0.251 | 0.000 | 0.000 | 0.352 | 0.000 | ||
| 1 spectrum, DLSFPYEAVEGCK | 0.000 | 0.000 | 0.009 | 0.310 | 0.000 | 0.000 | 0.487 | 0.195 | ||
| 1 spectrum, YVSFLK | 0.367 | 0.000 | 0.086 | 0.215 | 0.000 | 0.000 | 0.332 | 0.000 | ||
| 2 spectra, SEFPILAPGGGGGEK | 0.000 | 0.000 | 0.035 | 0.354 | 0.000 | 0.000 | 0.610 | 0.000 |
| Plot | Mito | Lyso or Perox | ER | Golgi | PM | Cytosol | Nucleus | ||||||
| Expt B |
3 peptides |
3 spectra |
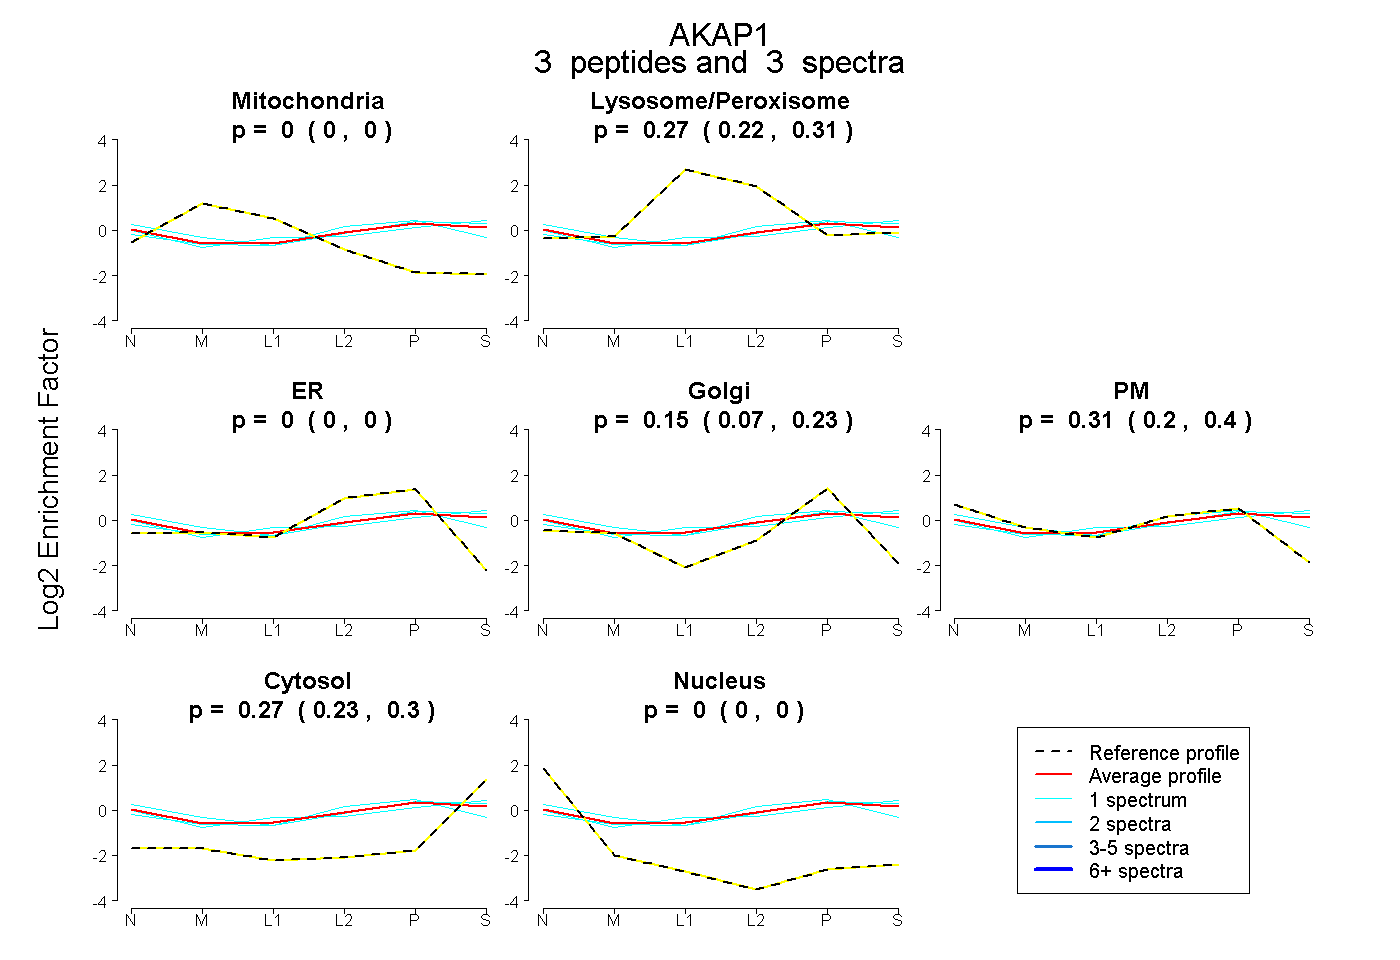 |
0.000 0.000 | 0.000 |
0.270 0.223 | 0.306 |
0.000 0.000 | 0.000 |
0.153 0.071 | 0.226 |
0.308 0.199 | 0.396 |
0.269 0.233 | 0.300 |
0.000 0.000 | 0.000 |
|||
| Plot | Lyso | Other | |||||||||||
| Expt C |
7 peptides |
30 spectra |
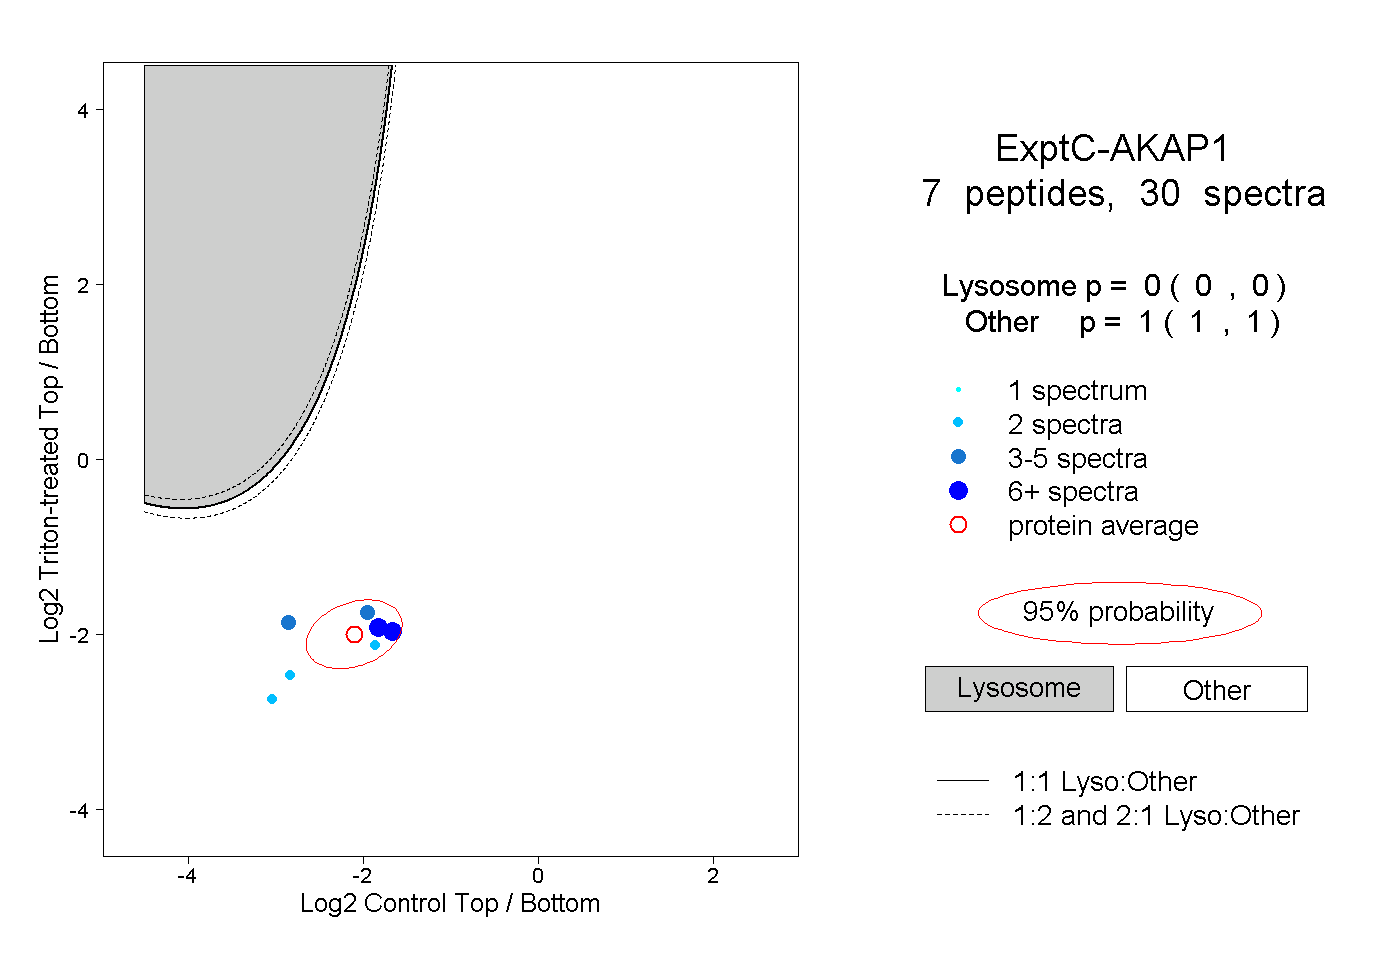 |
0.000 0.000 | 0.000 |
1.000 1.000 | 1.000 |
||||||||
| Plot | Lyso | Other | |||||||||||
| Expt D |
3 peptides |
3 spectra |
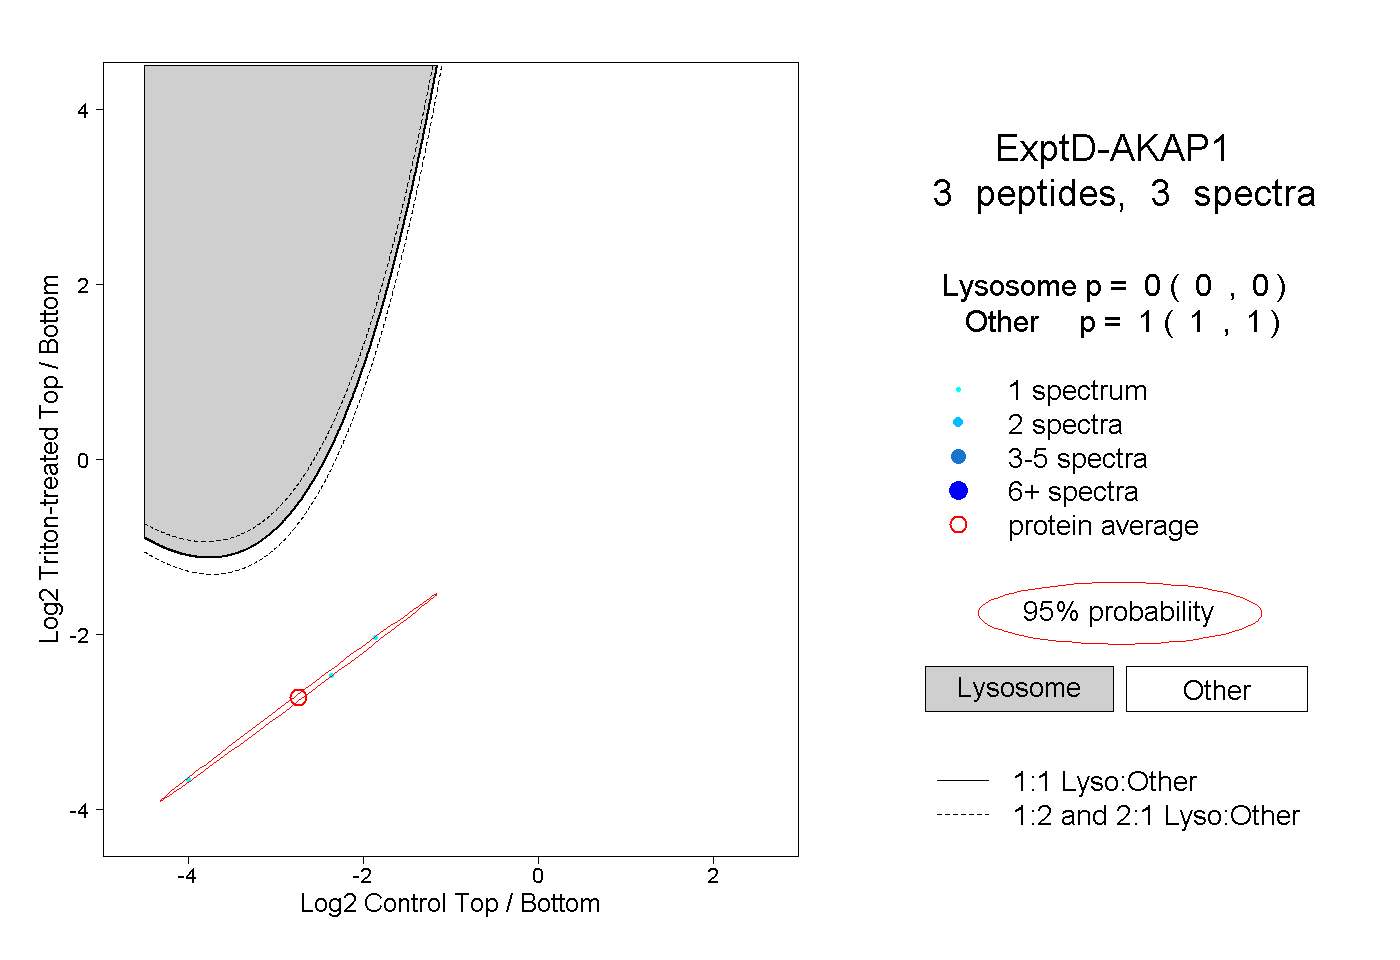 |
0.000 0.000 | 0.000 |
1.000 1.000 | 1.000 |