 4
4peptides
spectra
0.000 | 0.000
0.000 | 0.000
0.000 | 0.000
0.019 | 0.163
0.000 | 0.081
0.362 | 0.505
0.322 | 0.370
0.071 | 0.105
2peptides
spectra
0.000 | 0.000
1.000 | 1.000
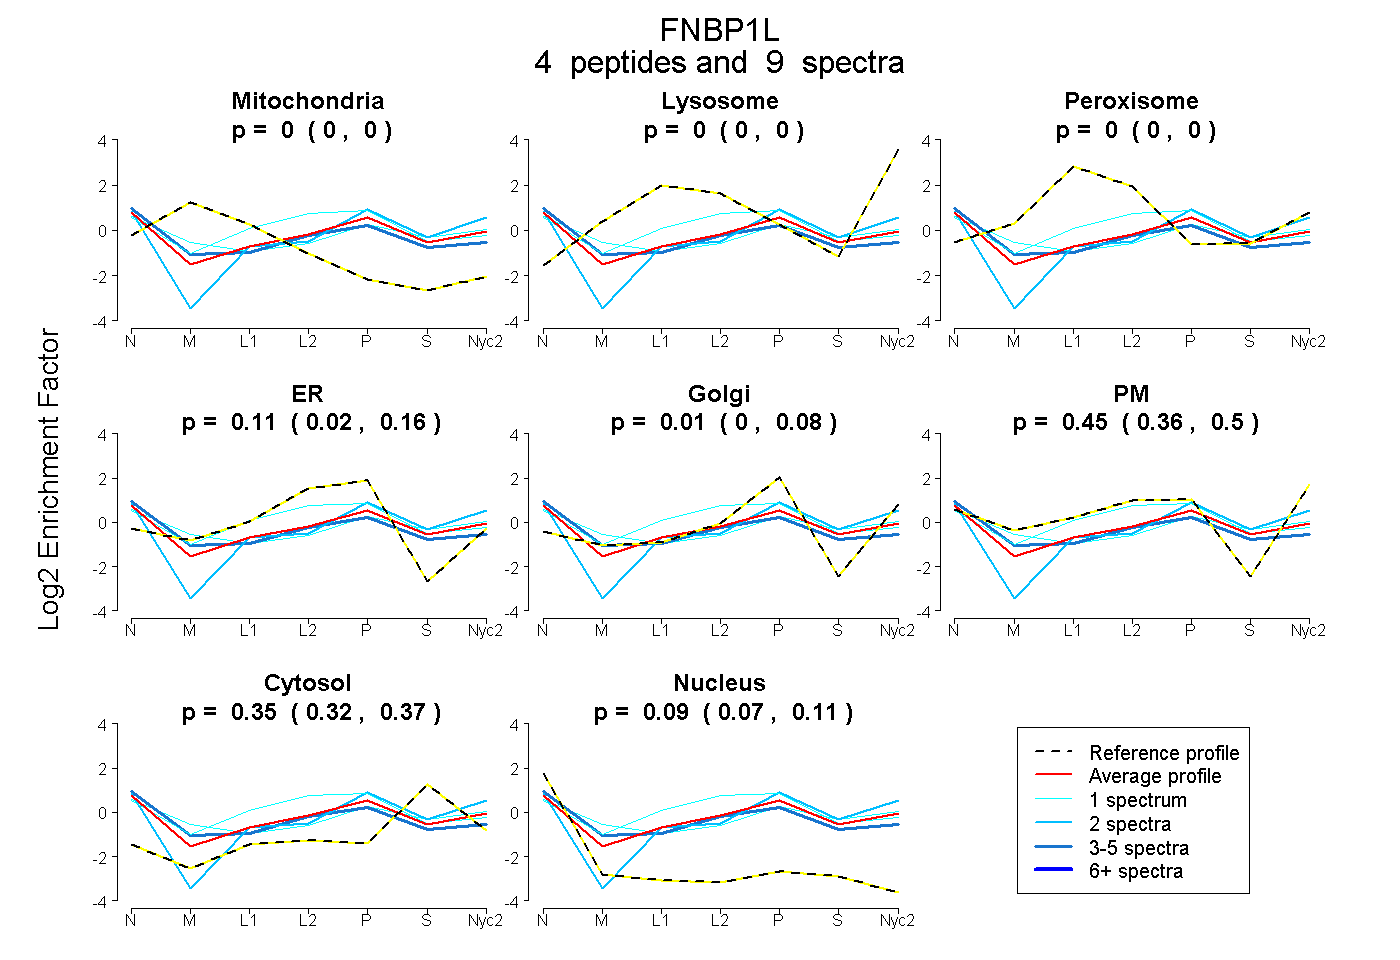
| Plot | Mito | Lyso | Perox | ER | Golgi | PM | Cytosol | Nucleus | |||||
| Expt A |
4 peptides |
9 spectra |
|
0.000 0.000 | 0.000 |
0.000 0.000 | 0.000 |
0.000 0.000 | 0.000 |
0.106 0.019 | 0.163 |
0.008 0.000 | 0.081 |
0.446 0.362 | 0.505 |
0.351 0.322 | 0.370 |
0.090 0.071 | 0.105 |
||
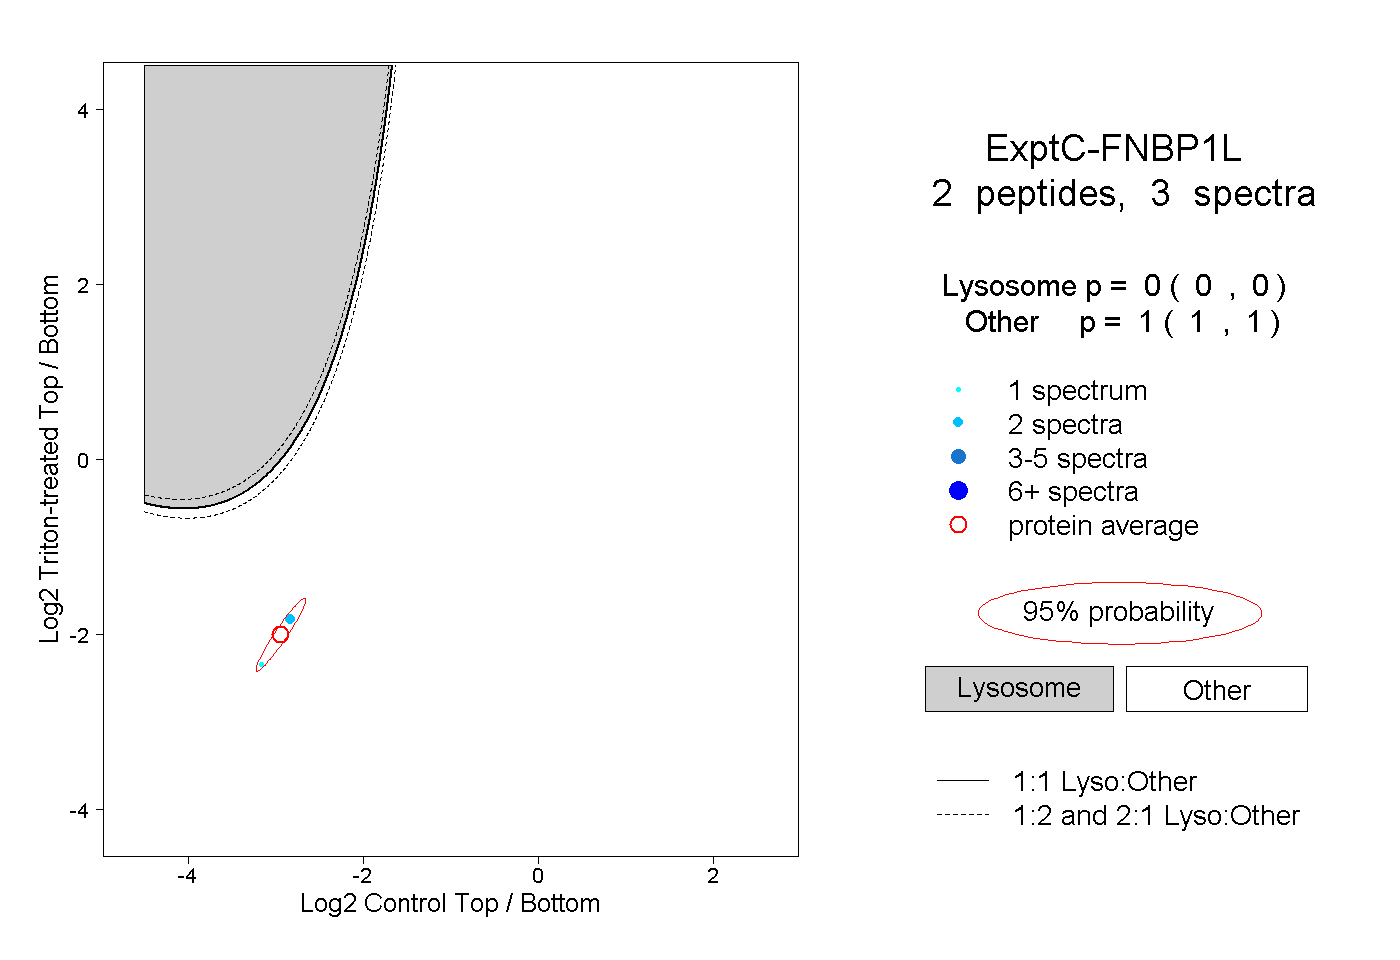
| Plot | Lyso | Other | |||||||||||
| Expt C |
2 peptides |
3 spectra |
|
0.000 0.000 | 0.000 |
1.000 1.000 | 1.000 |