 5
5peptides
spectra
0.000 | 0.000
0.000 | 0.000
0.000 | 0.000
0.000 | 0.000
0.884 | 0.918
0.000 | 0.000
0.036 | 0.095
0.013 | 0.041
1peptide
spectra
NA | NA
NA | NA
NA | NA
NA | NA
NA | NA
NA | NA
NA | NA
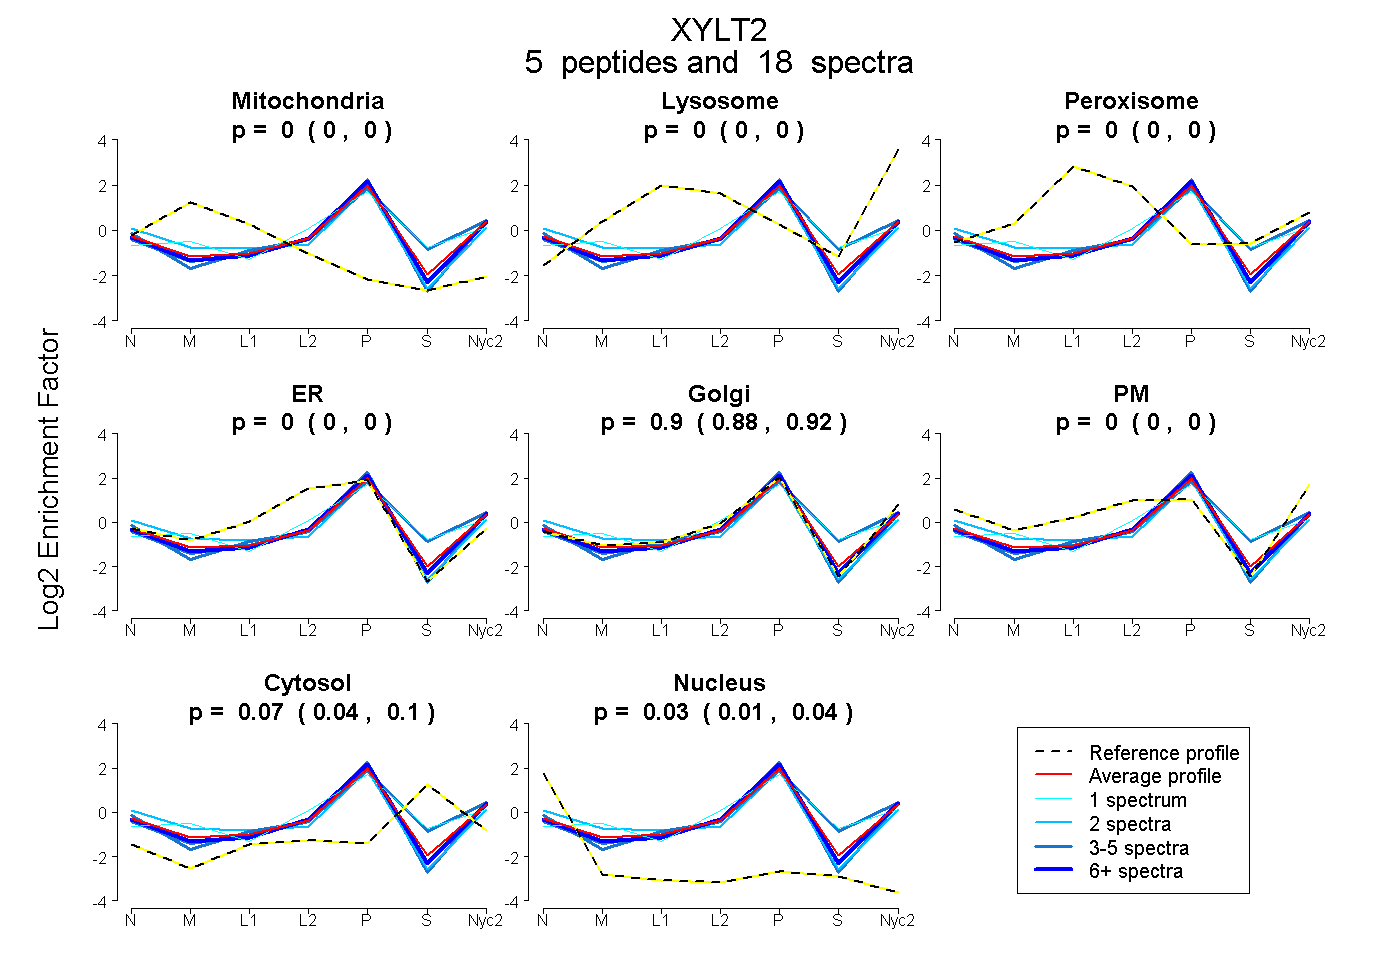
| Plot | Mito | Lyso | Perox | ER | Golgi | PM | Cytosol | Nucleus | |||||
| Expt A |
5 peptides |
18 spectra |
|
0.000 0.000 | 0.000 |
0.000 0.000 | 0.000 |
0.000 0.000 | 0.000 |
0.000 0.000 | 0.000 |
0.903 0.884 | 0.918 |
0.000 0.000 | 0.000 |
0.069 0.036 | 0.095 |
0.028 0.013 | 0.041 |
||
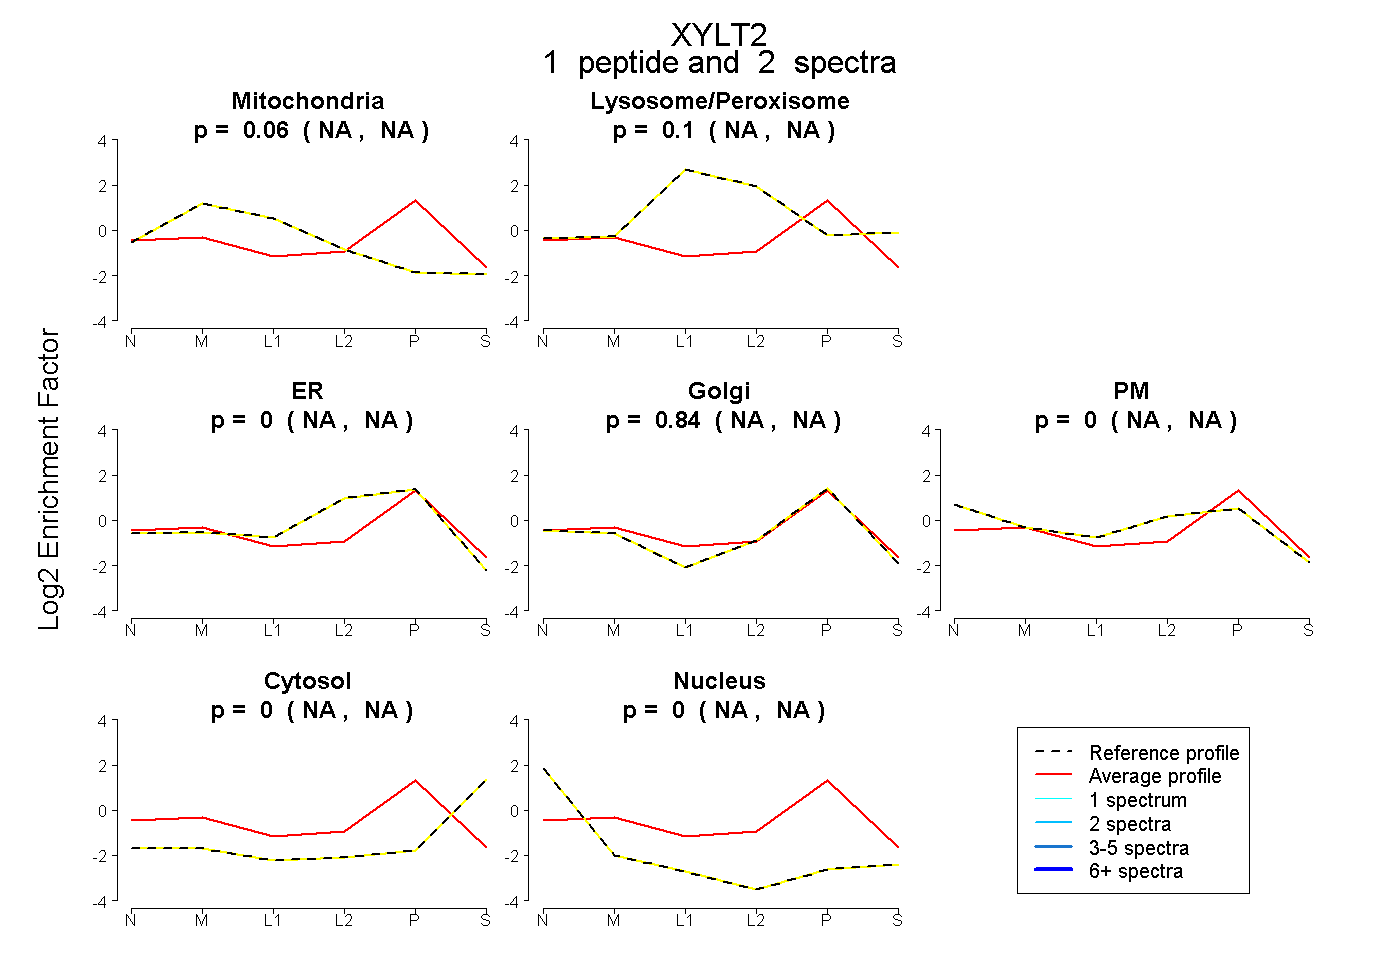
| Plot | Mito | Lyso or Perox | ER | Golgi | PM | Cytosol | Nucleus | ||||||
| Expt B |
1 peptide |
2 spectra |
|
0.058 NA | NA |
0.105 NA | NA |
0.000 NA | NA |
0.838 NA | NA |
0.000 NA | NA |
0.000 NA | NA |
0.000 NA | NA |