 4
4peptides
spectra
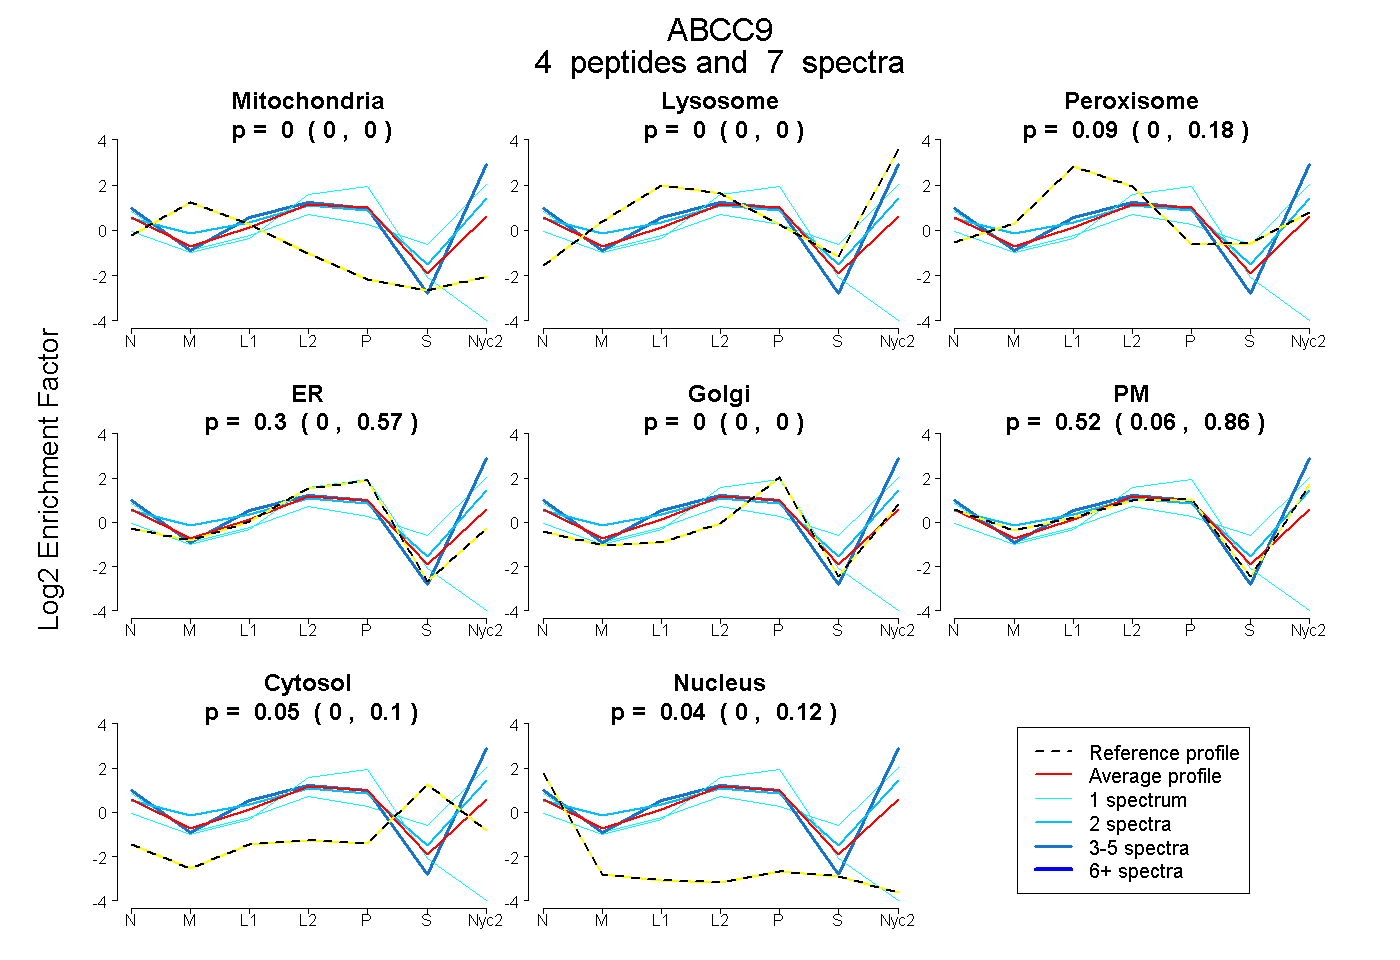
0.000 | 0.000
0.000 | 0.000
0.000 | 0.176
0.000 | 0.571
0.000 | 0.000
0.064 | 0.858
0.000 | 0.095
0.000 | 0.117
| Plot | Mito | Lyso | Perox | ER | Golgi | PM | Cytosol | Nucleus | |||||
| Expt A |
4 peptides |
7 spectra |
|
0.000 0.000 | 0.000 |
0.000 0.000 | 0.000 |
0.085 0.000 | 0.176 |
0.304 0.000 | 0.571 |
0.000 0.000 | 0.000 |
0.521 0.064 | 0.858 |
0.048 0.000 | 0.095 |
0.040 0.000 | 0.117 |
| 1 spectrum, EAYEEQK | 0.000 | 0.116 | 0.000 | 0.000 | 0.000 | 0.653 | 0.230 | 0.000 | ||
| 2 spectra, LYAWEHIFCK | 0.000 | 0.000 | 0.158 | 0.000 | 0.000 | 0.783 | 0.059 | 0.000 | ||
| 1 spectrum, VGEGYNFNSLMNEK | 0.000 | 0.000 | 0.000 | 0.802 | 0.000 | 0.000 | 0.000 | 0.198 | ||
| 3 spectra, LPLHTLR | 0.000 | 0.094 | 0.000 | 0.000 | 0.000 | 0.906 | 0.000 | 0.000 |
| Plot | Lyso | Other | |||||||||||
| Expt C |
8 peptides |
18 spectra |
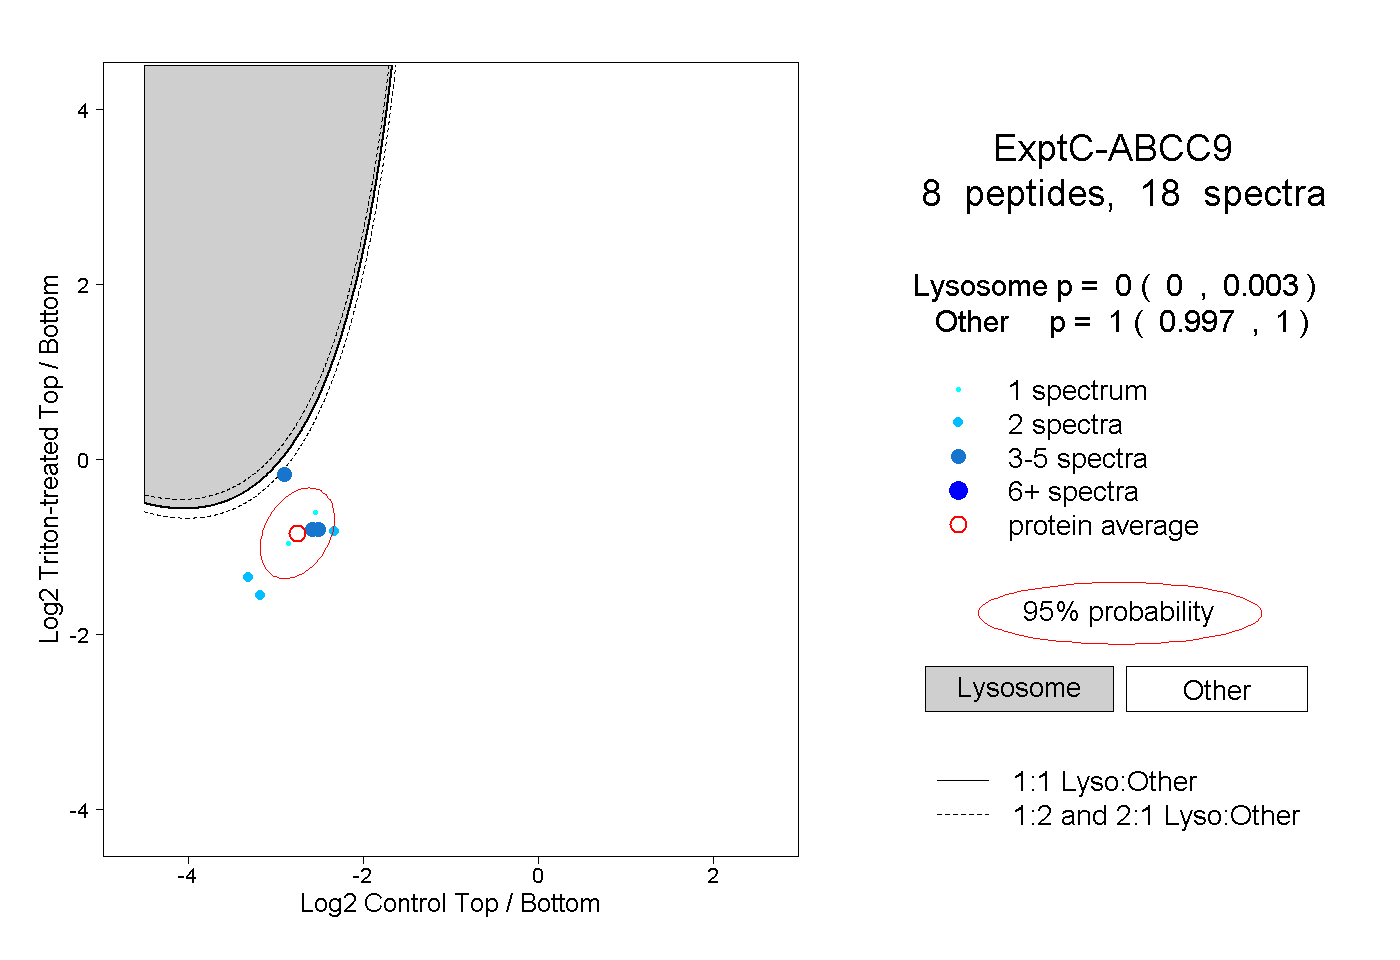 |
0.000 0.000 | 0.003 |
1.000 0.997 | 1.000 |