 17
17peptides
spectra
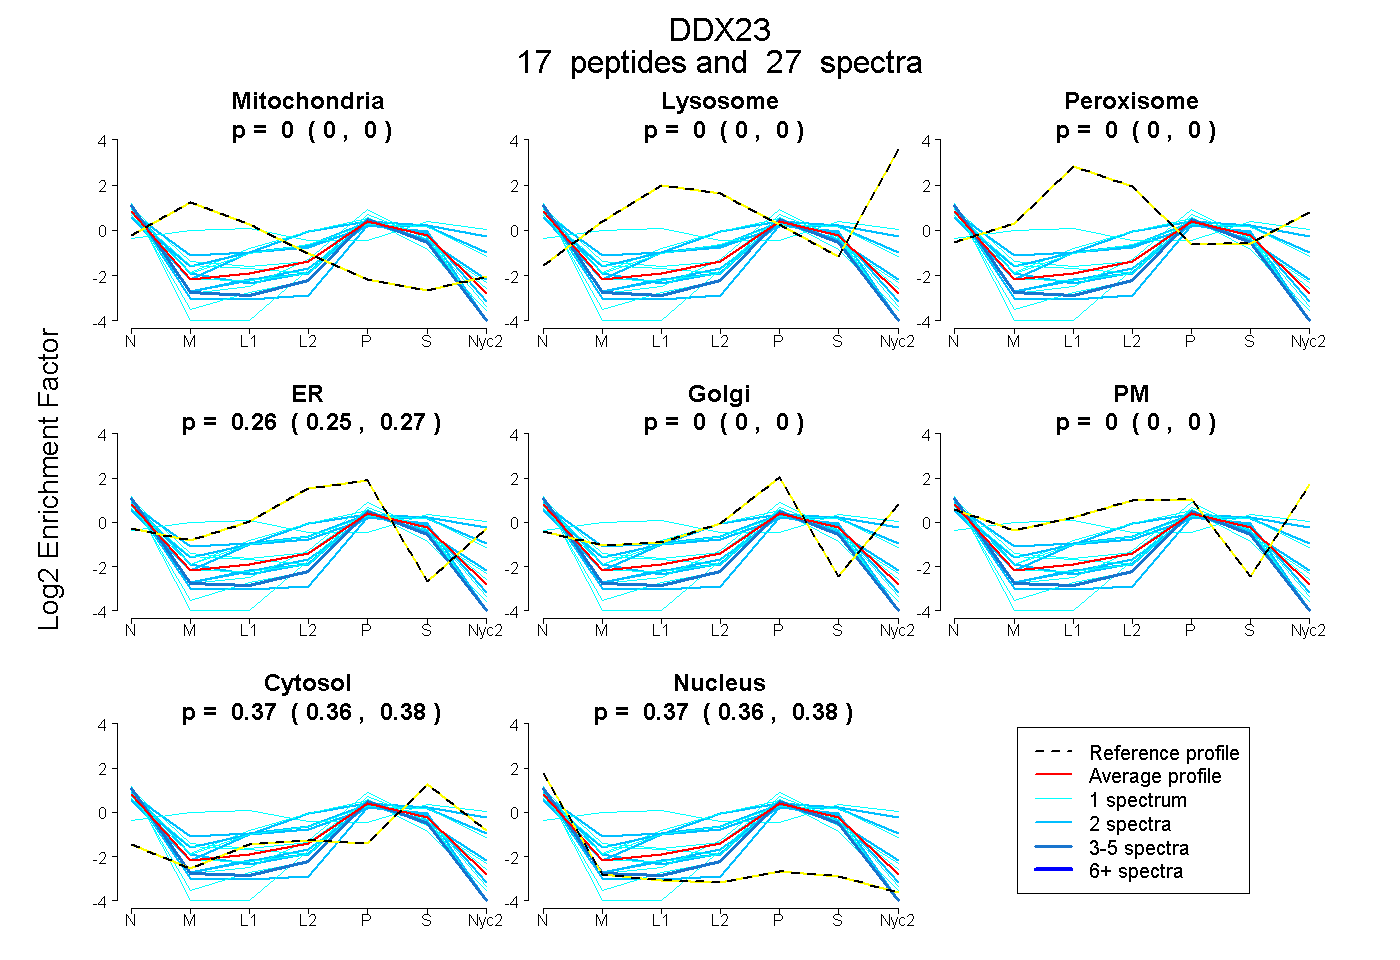
0.000 | 0.000
0.000 | 0.000
0.000 | 0.000
0.251 | 0.267
0.000 | 0.000
0.000 | 0.000
0.361 | 0.377
0.360 | 0.380
2peptides
spectra
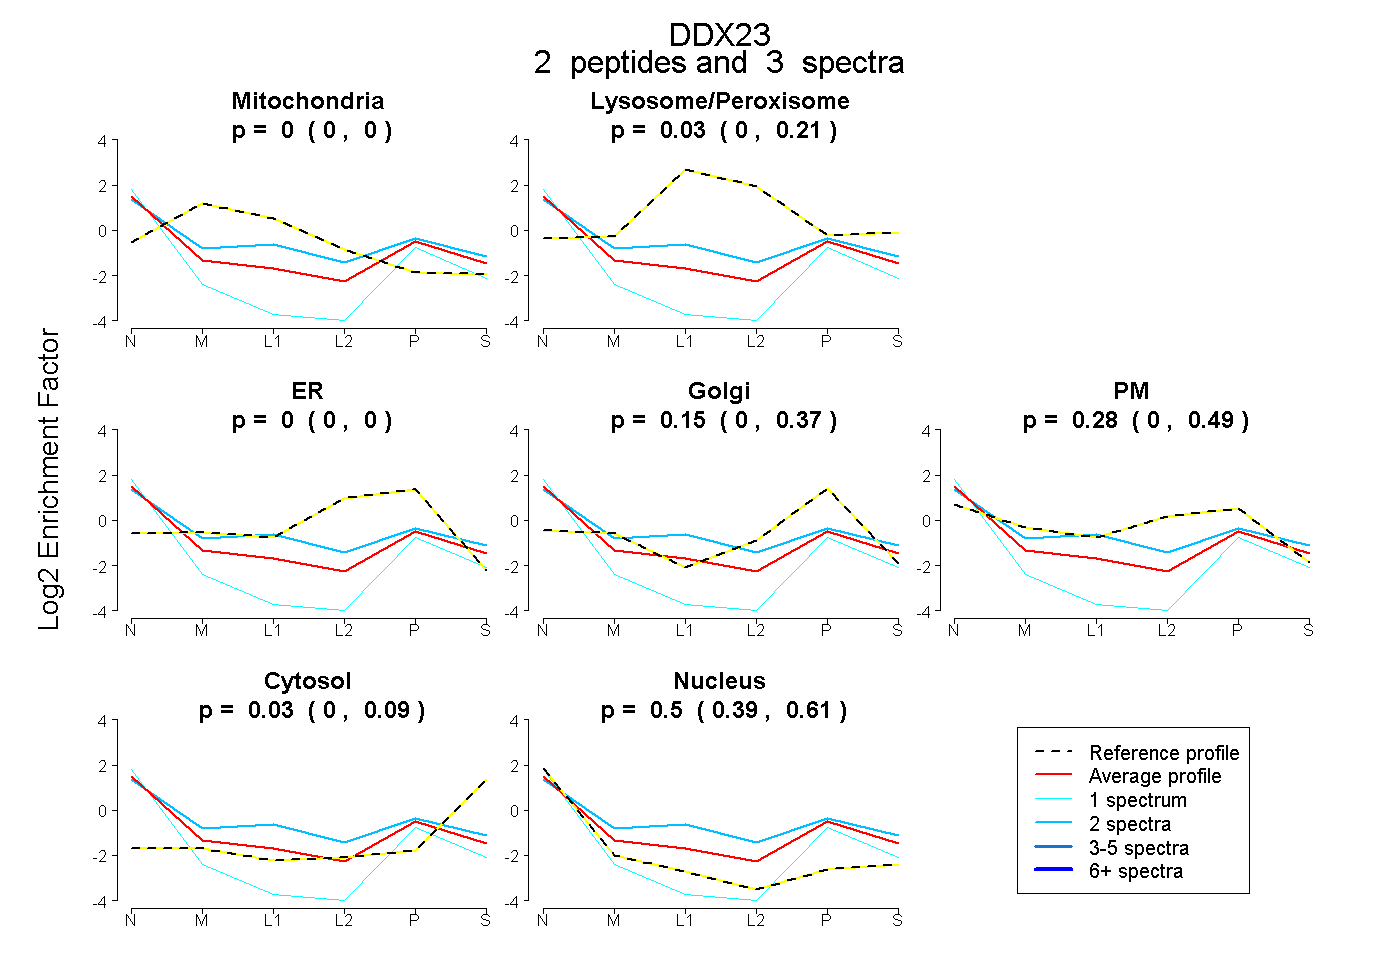
0.000 | 0.000
0.000 | 0.215
0.000 | 0.000
0.000 | 0.368
0.000 | 0.488
0.000 | 0.093
0.387 | 0.614
3peptides
spectra
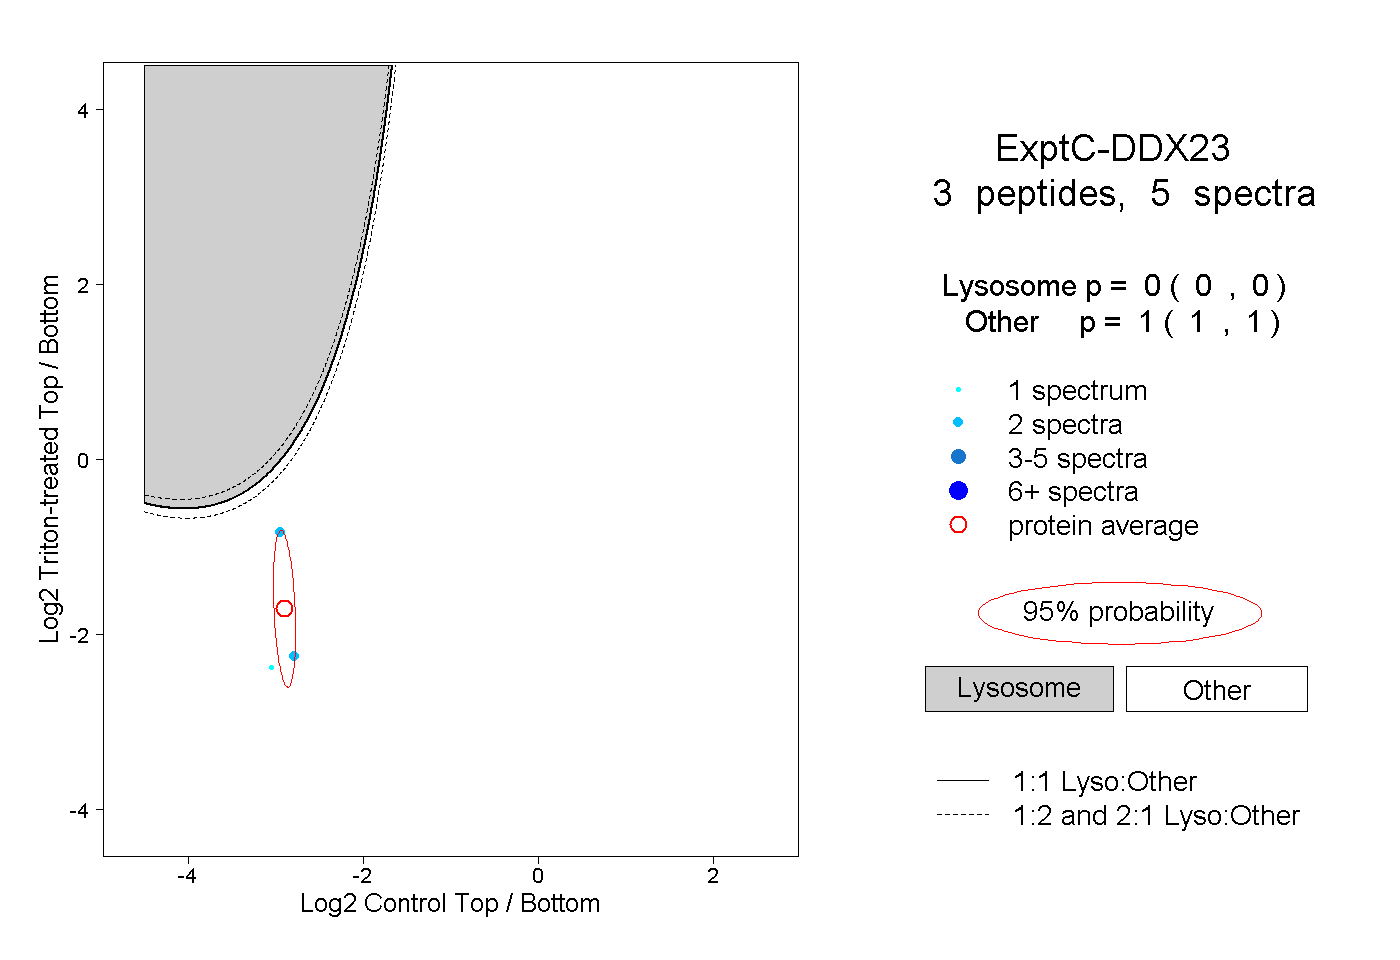
0.000 | 0.000
1.000 | 1.000
1peptide
spectra
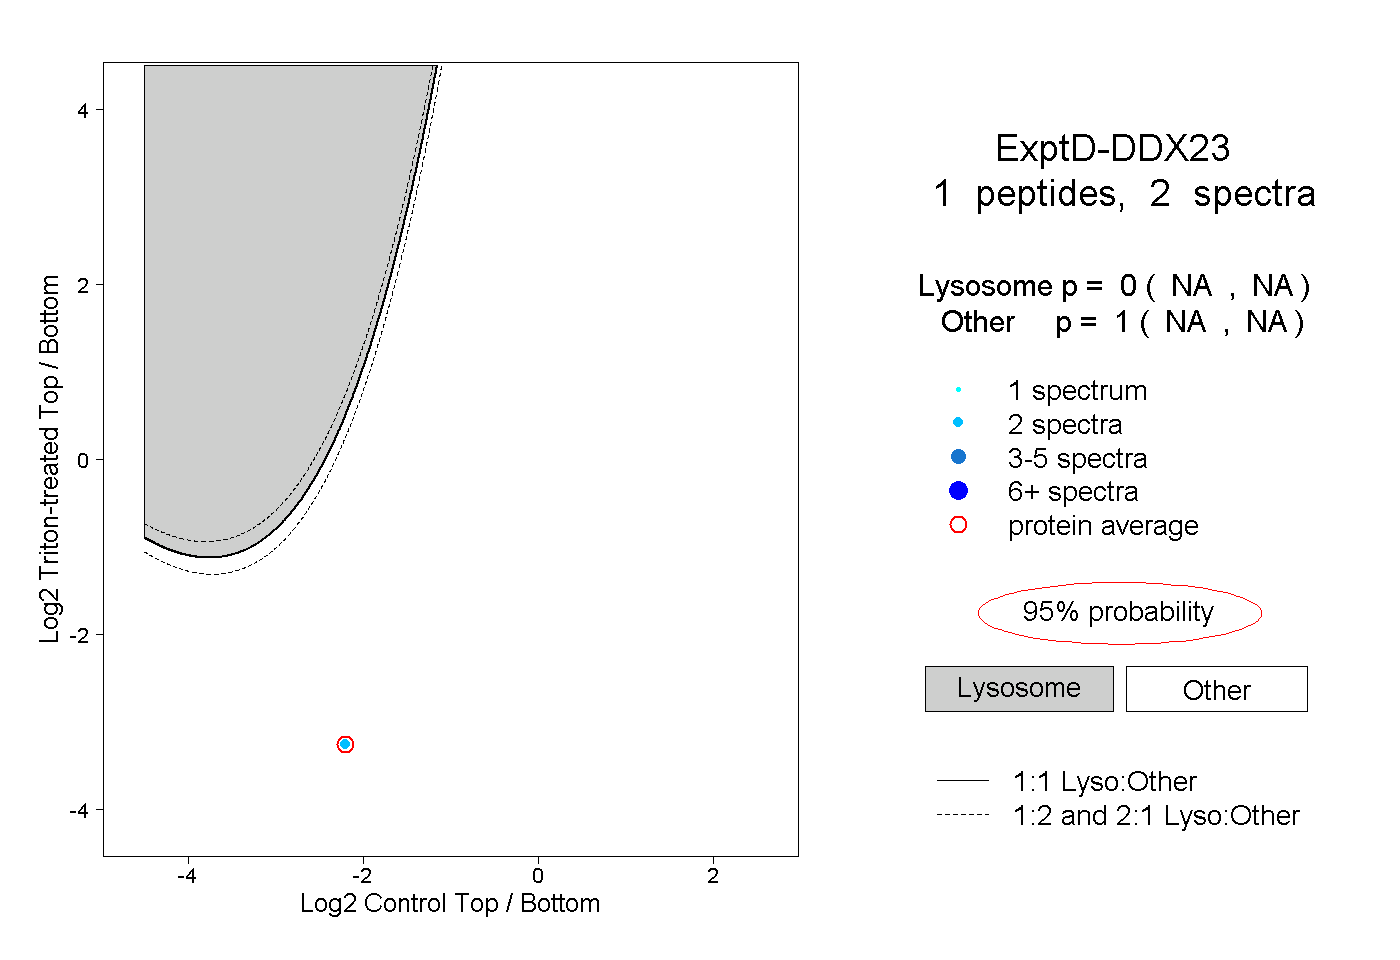
NA | NA
NA | NA