 1
1peptide
spectra
0.000 | 0.000
0.011 | 0.157
0.080 | 0.239
0.000 | 0.000
0.114 | 0.299
0.209 | 0.437
0.169 | 0.217
0.000 | 0.000
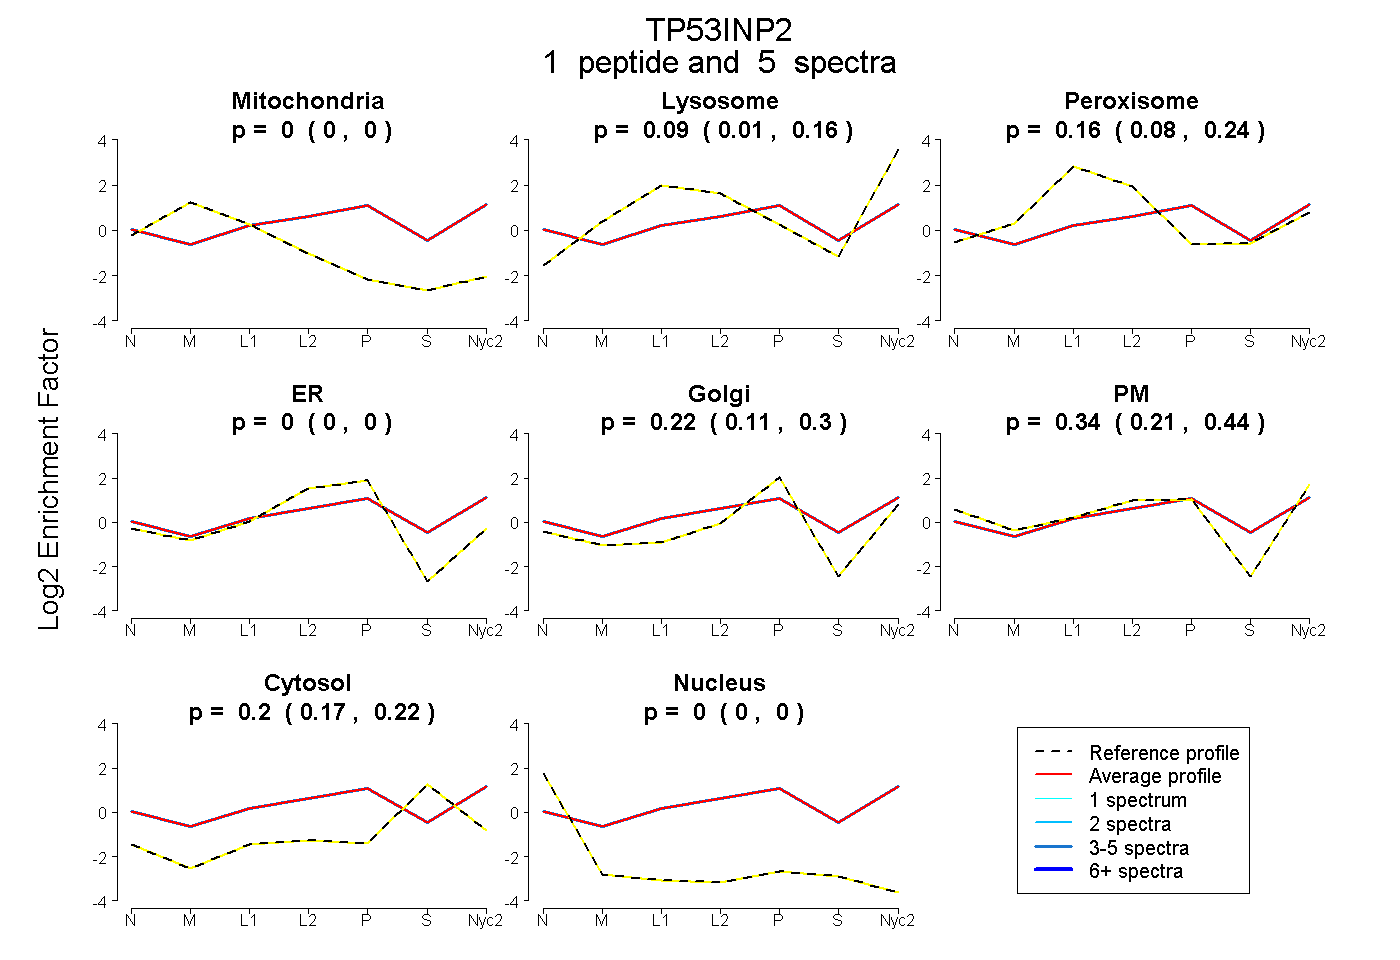
| Plot | Mito | Lyso | Perox | ER | Golgi | PM | Cytosol | Nucleus | |||||
| Expt A |
1 peptide |
5 spectra |
|
0.000 0.000 | 0.000 |
0.091 0.011 | 0.157 |
0.162 0.080 | 0.239 |
0.000 0.000 | 0.000 |
0.215 0.114 | 0.299 |
0.336 0.209 | 0.437 |
0.196 0.169 | 0.217 |
0.000 0.000 | 0.000 |