 9
9peptides
spectra
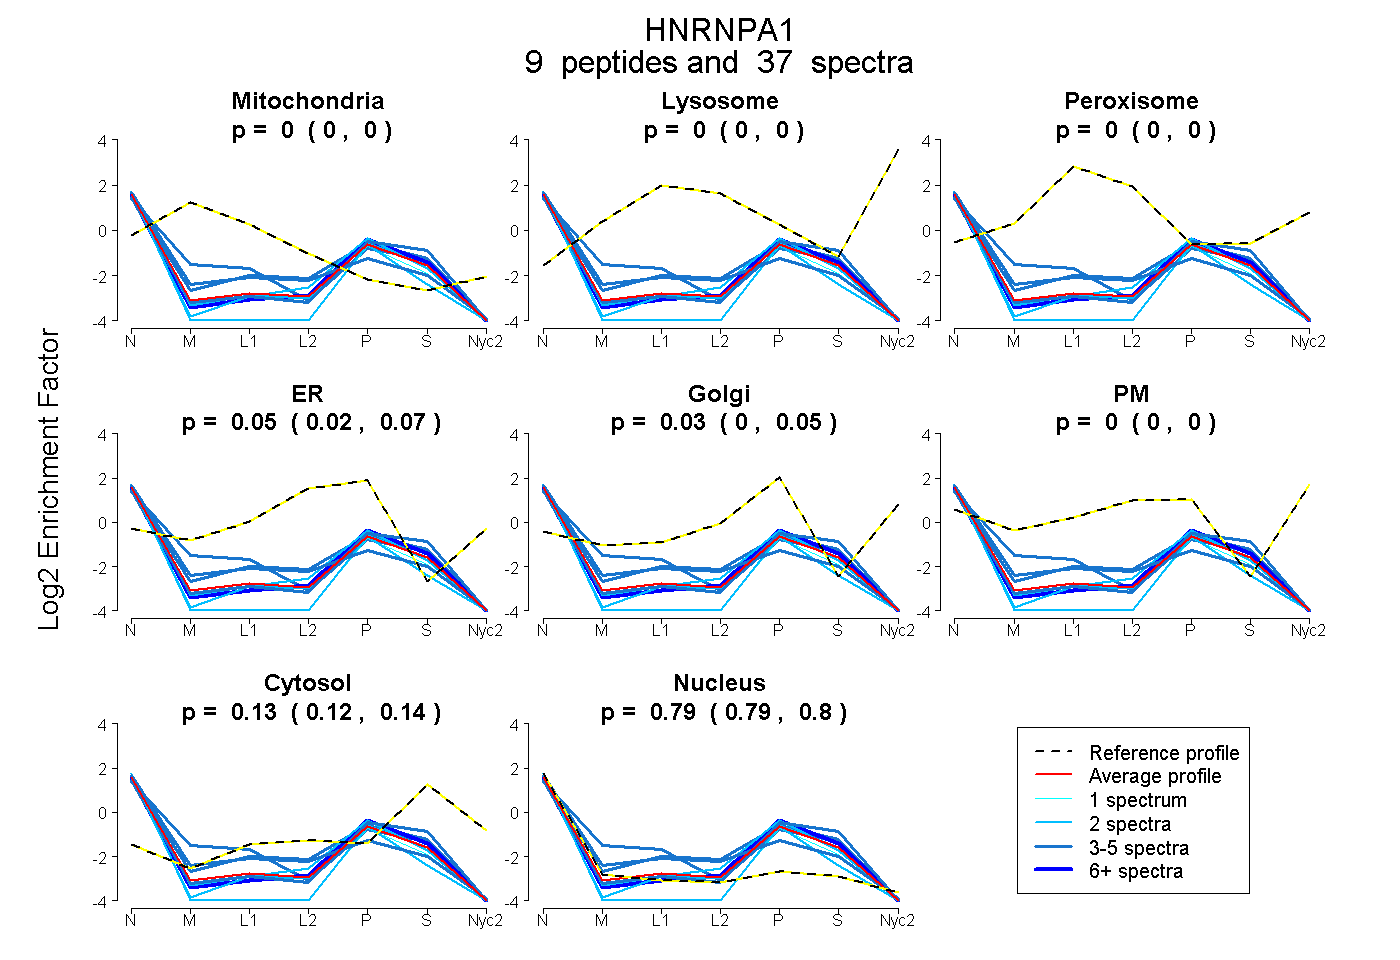
0.000 | 0.000
0.000 | 0.000
0.000 | 0.000
0.020 | 0.069
0.003 | 0.049
0.000 | 0.000
0.124 | 0.142
0.787 | 0.799
| Plot | Mito | Lyso | Perox | ER | Golgi | PM | Cytosol | Nucleus | |||||
| Expt A |
9 peptides |
37 spectra |
|
0.000 0.000 | 0.000 |
0.000 0.000 | 0.000 |
0.000 0.000 | 0.000 |
0.046 0.020 | 0.069 |
0.027 0.003 | 0.049 |
0.000 0.000 | 0.000 |
0.133 0.124 | 0.142 |
0.793 0.787 | 0.799 |
| 14 spectra, IEVIEIMTDR | 0.000 | 0.000 | 0.000 | 0.000 | 0.068 | 0.000 | 0.154 | 0.778 | ||
| 3 spectra, EDSQRPGAHLTVK | 0.000 | 0.000 | 0.000 | 0.158 | 0.000 | 0.000 | 0.168 | 0.673 | ||
| 2 spectra, QEMASASSSQR | 0.000 | 0.000 | 0.000 | 0.097 | 0.000 | 0.000 | 0.112 | 0.791 | ||
| 2 spectra, SSGPYGGGGQYFAKPR | 0.000 | 0.000 | 0.000 | 0.000 | 0.022 | 0.000 | 0.000 | 0.978 | ||
| 3 spectra, SGSGNFGGGR | 0.000 | 0.000 | 0.000 | 0.000 | 0.004 | 0.000 | 0.257 | 0.739 | ||
| 2 spectra, LFIGGLSFETTDESLR | 0.000 | 0.000 | 0.000 | 0.000 | 0.063 | 0.000 | 0.131 | 0.805 | ||
| 5 spectra, YHTVNGHNCEVR | 0.000 | 0.000 | 0.000 | 0.170 | 0.000 | 0.000 | 0.051 | 0.779 | ||
| 5 spectra, DYFEQYGK | 0.148 | 0.000 | 0.000 | 0.061 | 0.000 | 0.000 | 0.145 | 0.646 | ||
| 1 spectrum, NQGGYGGSSSSSSYGSGR | 0.000 | 0.000 | 0.000 | 0.000 | 0.000 | 0.000 | 0.055 | 0.945 |
| Plot | Mito | Lyso or Perox | ER | Golgi | PM | Cytosol | Nucleus | ||||||
| Expt B |
4 peptides |
4 spectra |
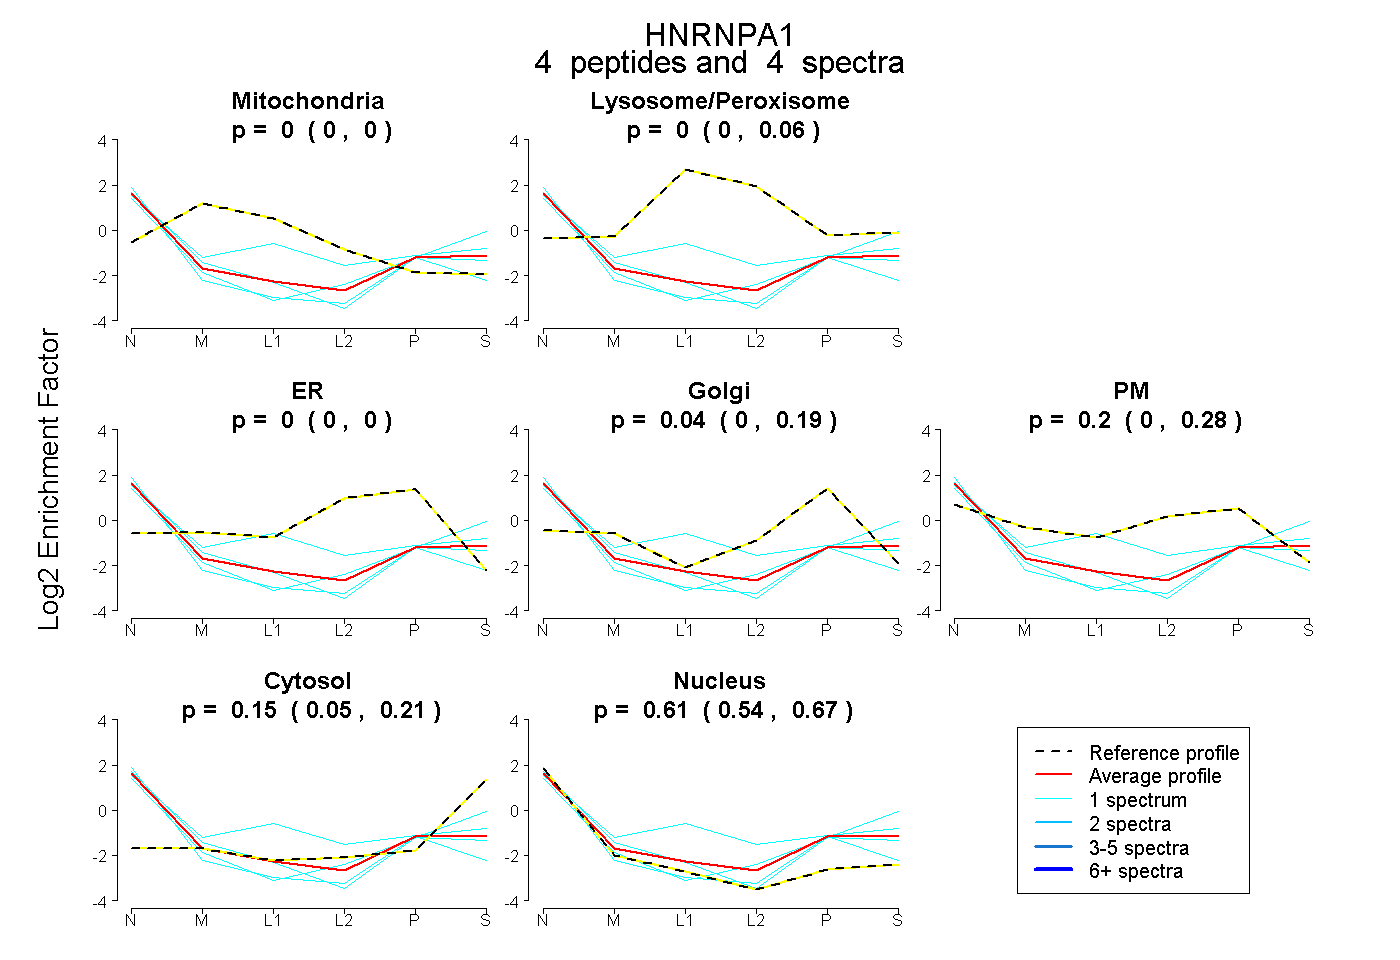 |
0.000 0.000 | 0.000 |
0.000 0.000 | 0.065 |
0.000 0.000 | 0.000 |
0.041 0.000 | 0.185 |
0.204 0.000 | 0.284 |
0.148 0.053 | 0.206 |
0.607 0.544 | 0.671 |
|||
| Plot | Lyso | Other | |||||||||||
| Expt C |
5 peptides |
12 spectra |
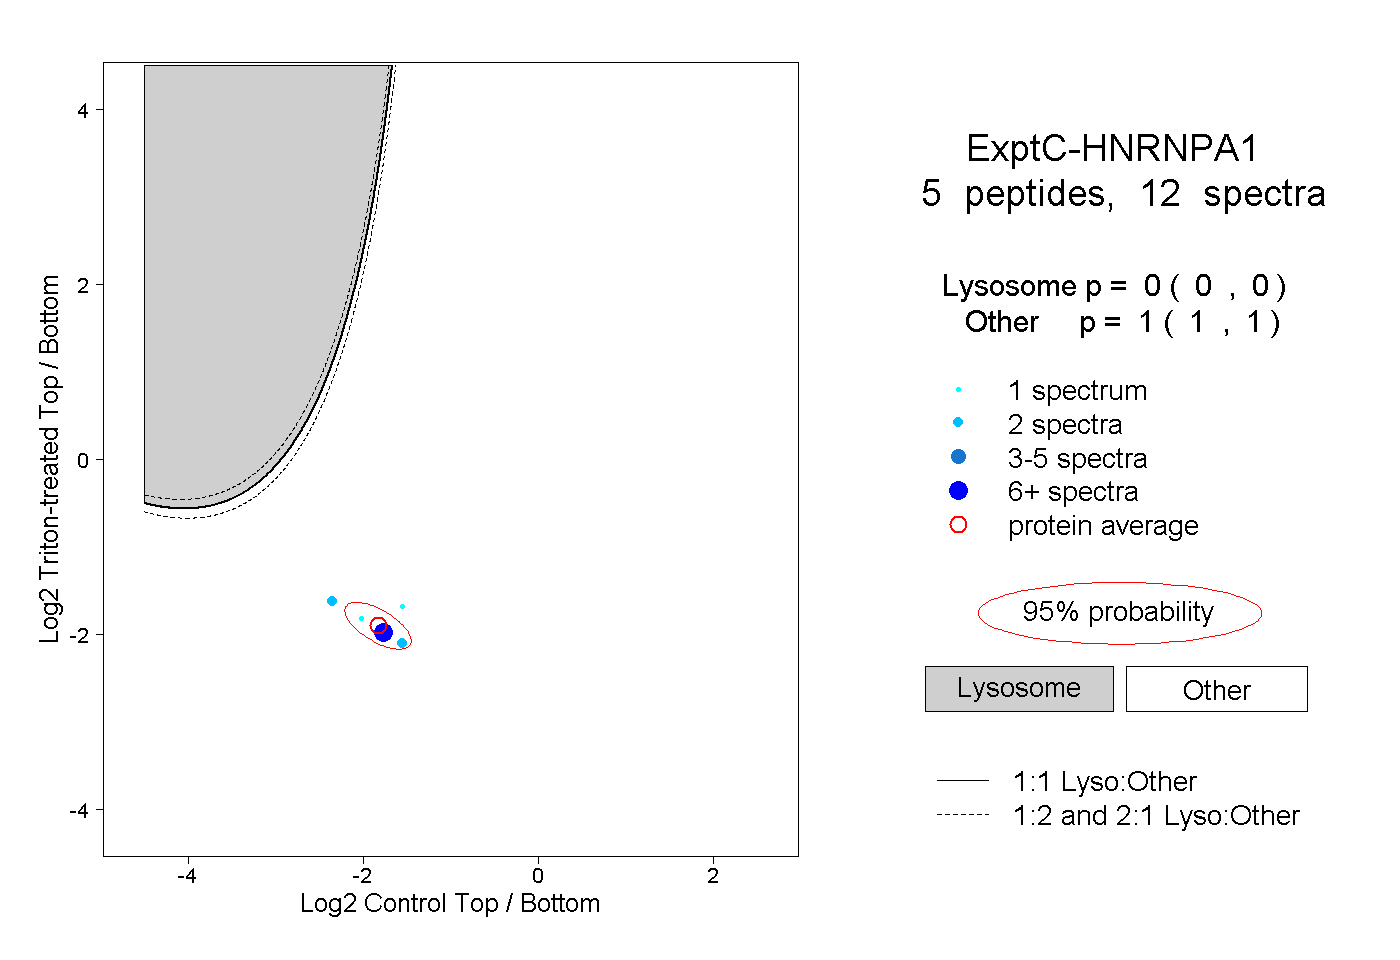 |
0.000 0.000 | 0.000 |
1.000 1.000 | 1.000 |