 4
4peptides
spectra
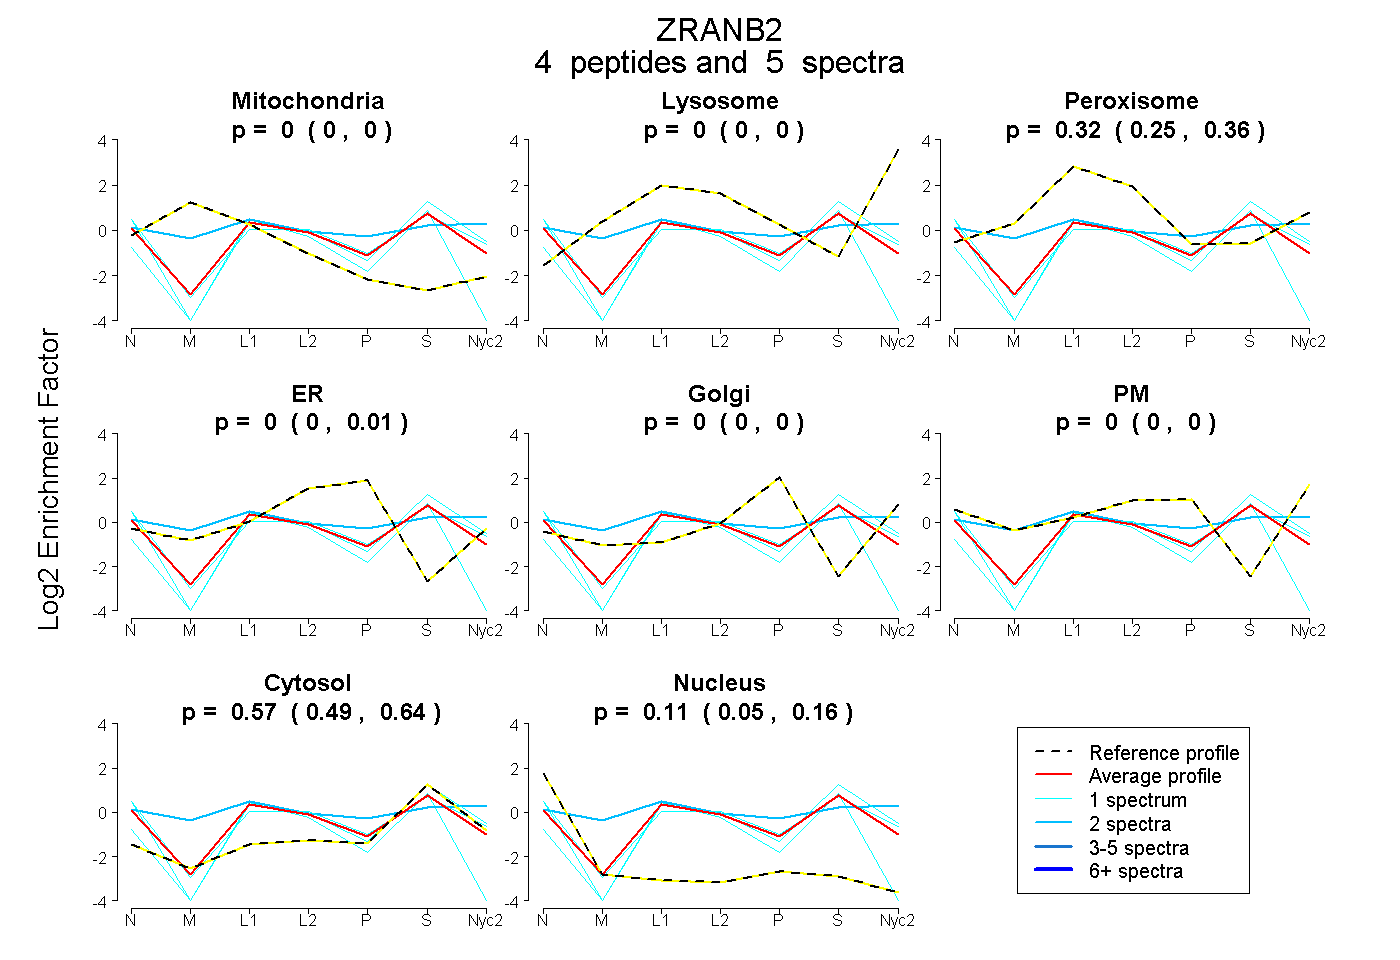
0.000 | 0.000
0.000 | 0.000
0.247 | 0.363
0.000 | 0.008
0.000 | 0.000
0.000 | 0.001
0.494 | 0.642
0.047 | 0.156
| Plot | Mito | Lyso | Perox | ER | Golgi | PM | Cytosol | Nucleus | |||||
| Expt A |
4 peptides |
5 spectra |
|
0.000 0.000 | 0.000 |
0.000 0.000 | 0.000 |
0.318 0.247 | 0.363 |
0.000 0.000 | 0.008 |
0.000 0.000 | 0.000 |
0.000 0.000 | 0.001 |
0.574 0.494 | 0.642 |
0.108 0.047 | 0.156 |
| 1 spectrum, YNLDASEEEDSNK | 0.000 | 0.000 | 0.198 | 0.000 | 0.000 | 0.000 | 0.802 | 0.000 | ||
| 2 spectra, GLFSANDWQCK | 0.045 | 0.000 | 0.335 | 0.000 | 0.000 | 0.244 | 0.376 | 0.000 | ||
| 1 spectrum, SRPSSPAVR | 0.000 | 0.000 | 0.293 | 0.000 | 0.000 | 0.025 | 0.564 | 0.118 | ||
| 1 spectrum, AVGPASILK | 0.000 | 0.000 | 0.163 | 0.000 | 0.000 | 0.000 | 0.514 | 0.323 |
| Plot | Lyso | Other | |||||||||||
| Expt C |
6 peptides |
13 spectra |
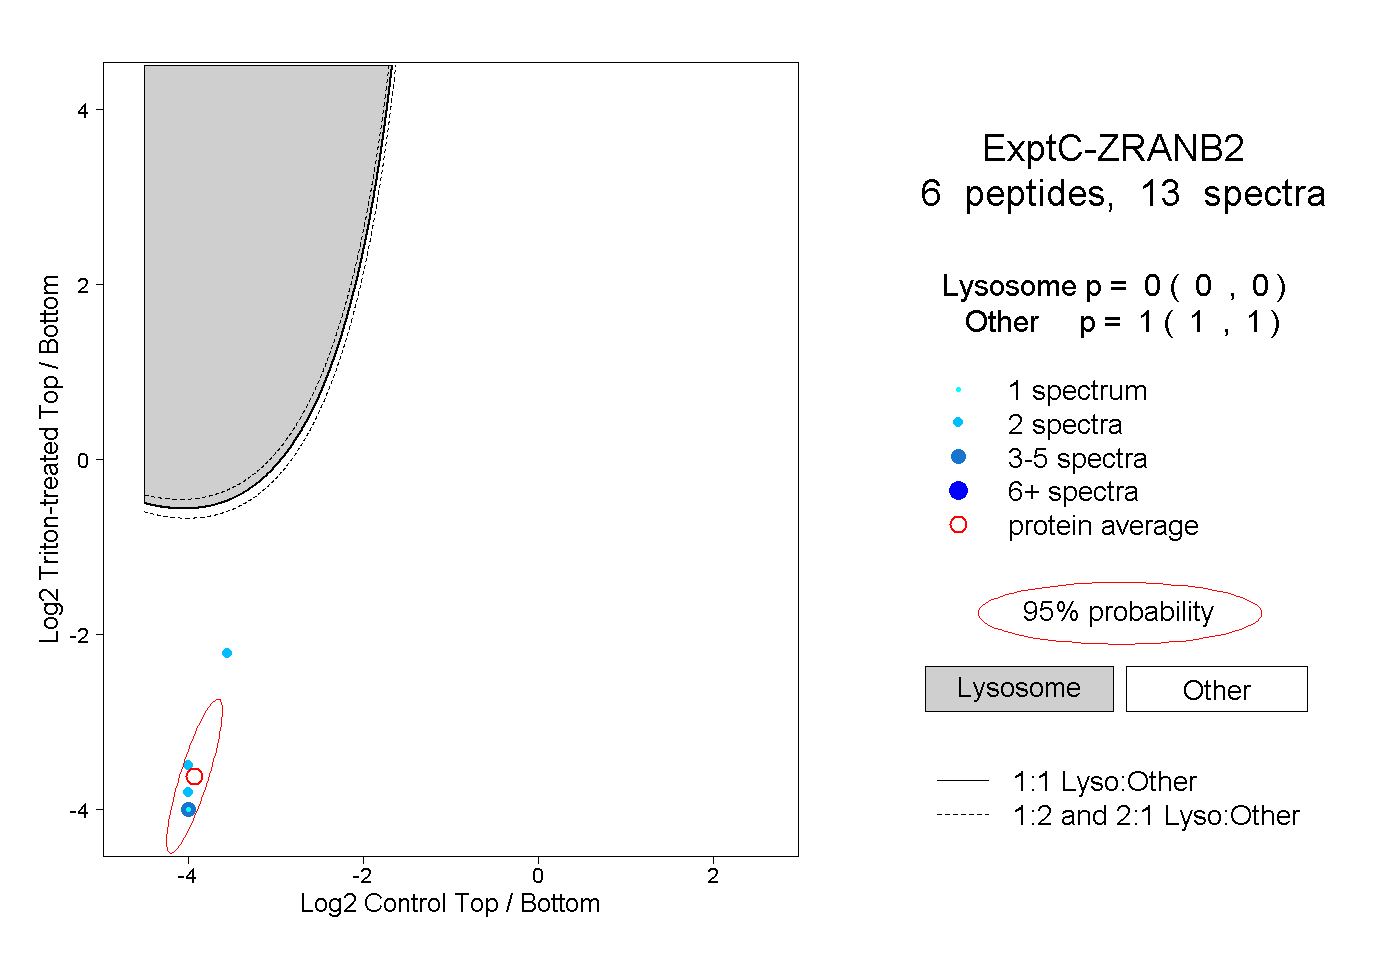 |
0.000 0.000 | 0.000 |
1.000 1.000 | 1.000 |