ATP6V0A1
[ENSRNOP00000052113]
Main page
| | | Plot |
Mito |
Lyso |
|
Perox |
ER |
Golgi |
PM |
Cytosol |
Nucleus |
|
| Expt A |
 20
20
peptides |
65
spectra |
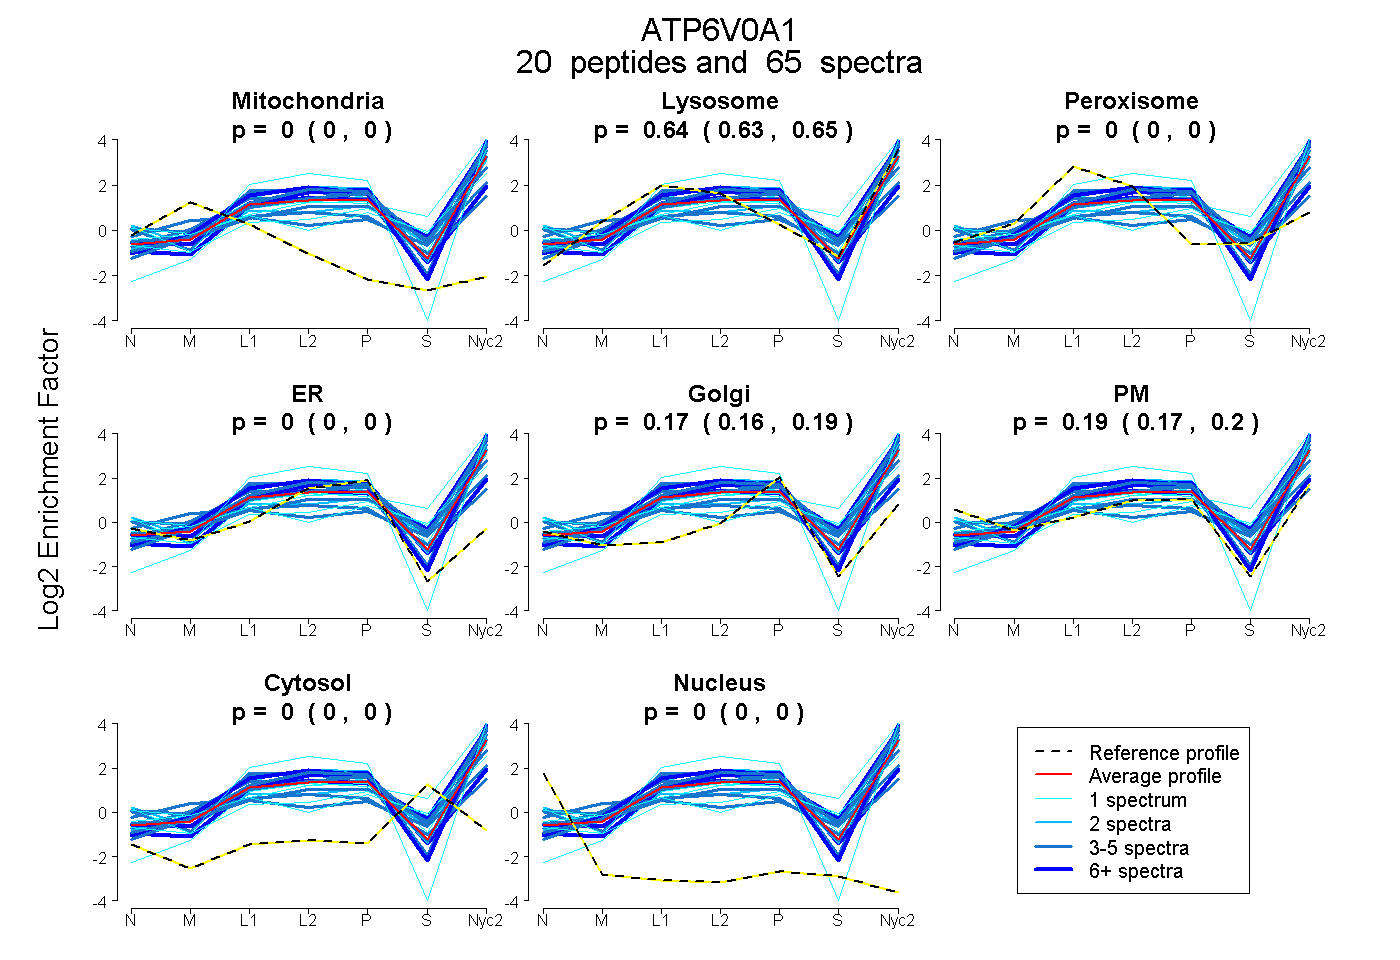 |
0.000
0.000 | 0.000 |
0.638
0.629 | 0.646 |
|
0.000
0.000 | 0.000 |
0.000
0.000 | 0.000 |
0.175
0.160 | 0.186 |
0.187
0.168 | 0.203 |
0.000
0.000 | 0.000 |
0.000
0.000 | 0.000 |
|
| | | Plot |
Mito |
|
Lyso or Perox |
|
ER |
Golgi |
PM |
Cytosol |
Nucleus |
|
| Expt B |
10
peptides |
23
spectra |
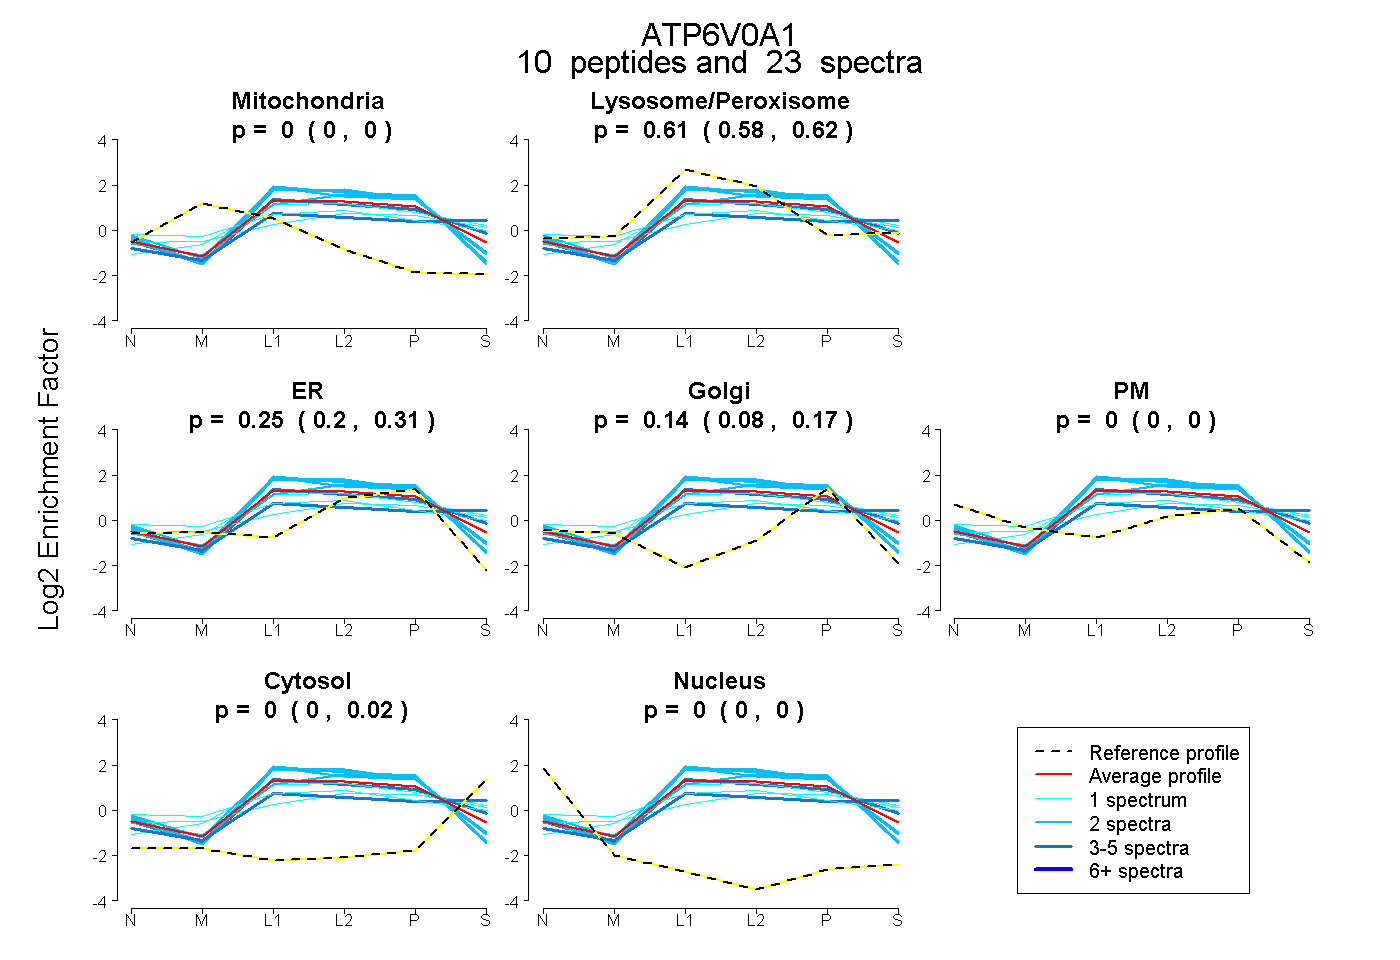 |
0.000
0.000 | 0.000 |
|
0.605
0.579 | 0.622 |
|
0.253
0.202 | 0.310 |
0.138
0.082 | 0.169 |
0.000
0.000 | 0.000 |
0.003
0.000 | 0.019 |
0.000
0.000 | 0.000 |
|
| | | Plot |
|
Lyso |
|
|
|
|
|
|
|
Other |
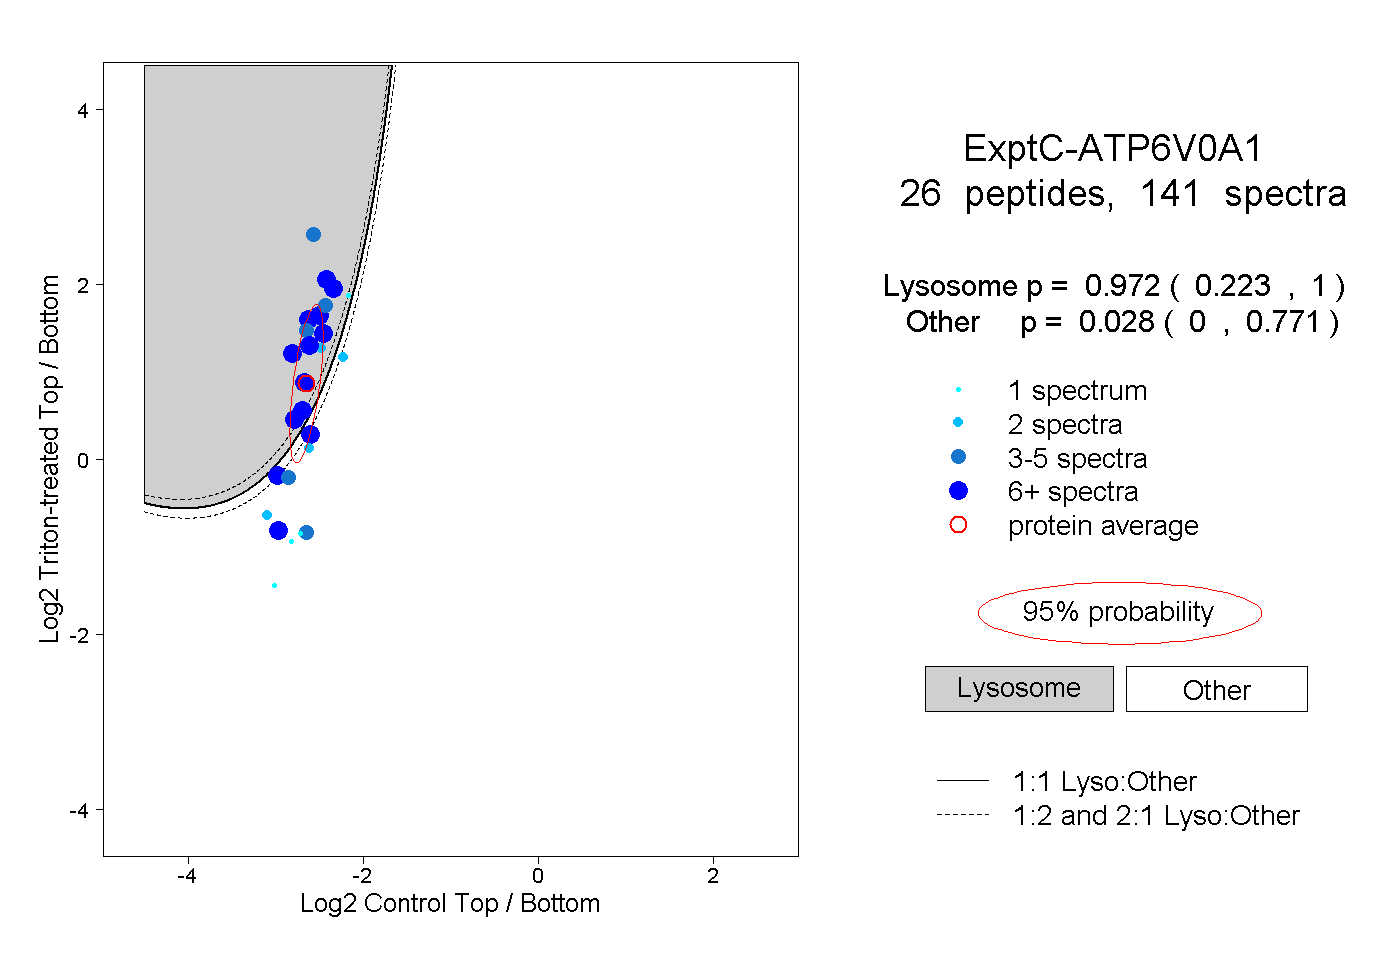
| Expt C |
26
peptides |
141
spectra |
 |
|
0.972
0.223 | 1.000 |
|
|
|
|
|
|
|
0.028
0.000 | 0.771 |
| | | Plot |
|
Lyso |
|
|
|
|
|
|
|
Other |
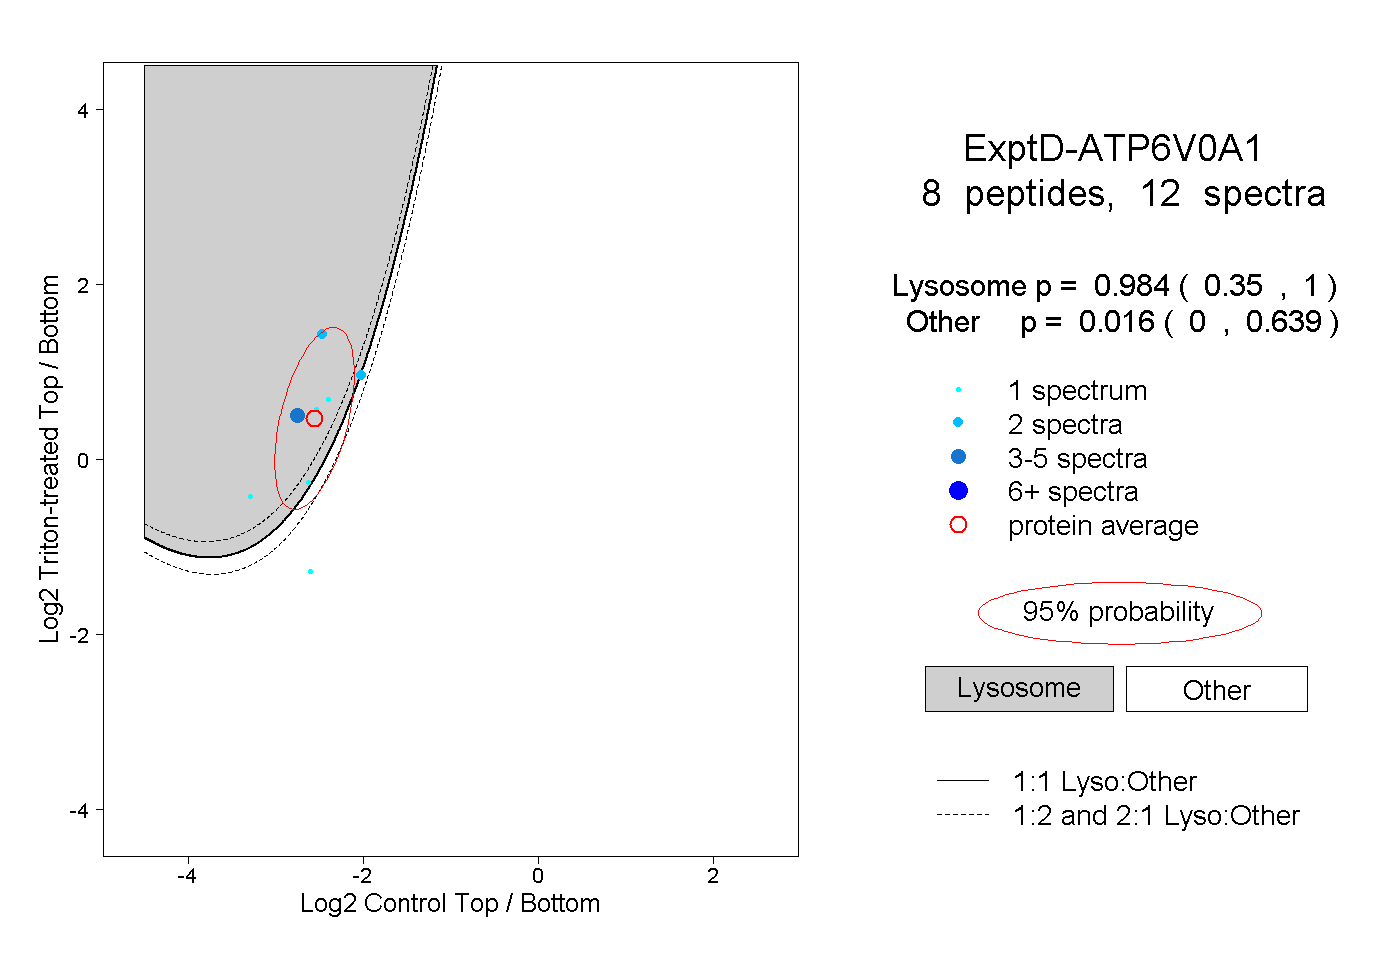
| Expt D |
8
peptides |
12
spectra |
 |
|
0.984
0.350 | 1.000 |
|
|
|
|
|
|
|
0.016
0.000 | 0.639 |
| 1 spectrum, HLGTLNFGGIR |
|
0.603 |
|
|
|
|
|
|
|
0.397 |
| 3 spectra, DLNPDVNVFQR |
|
0.998 |
|
|
|
|
|
|
|
0.002 |
| 1 spectrum, LTFLNSFK |
|
0.003 |
|
|
|
|
|
|
|
0.997 |
| 1 spectrum, ICEGFR |
|
0.982 |
|
|
|
|
|
|
|
0.018 |
| 1 spectrum, VLQAAAK |
|
0.989 |
|
|
|
|
|
|
|
0.011 |
| 1 spectrum, EMASGVNTR |
|
0.974 |
|
|
|
|
|
|
|
0.026 |
| 2 spectra, ASLYPCPETPQER |
|
1.000 |
|
|
|
|
|
|
|
0.000 |
| 2 spectra, IPTFER |
|
0.476 |
|
|
|
|
|
|
|
0.524 |