19
19peptides
spectra
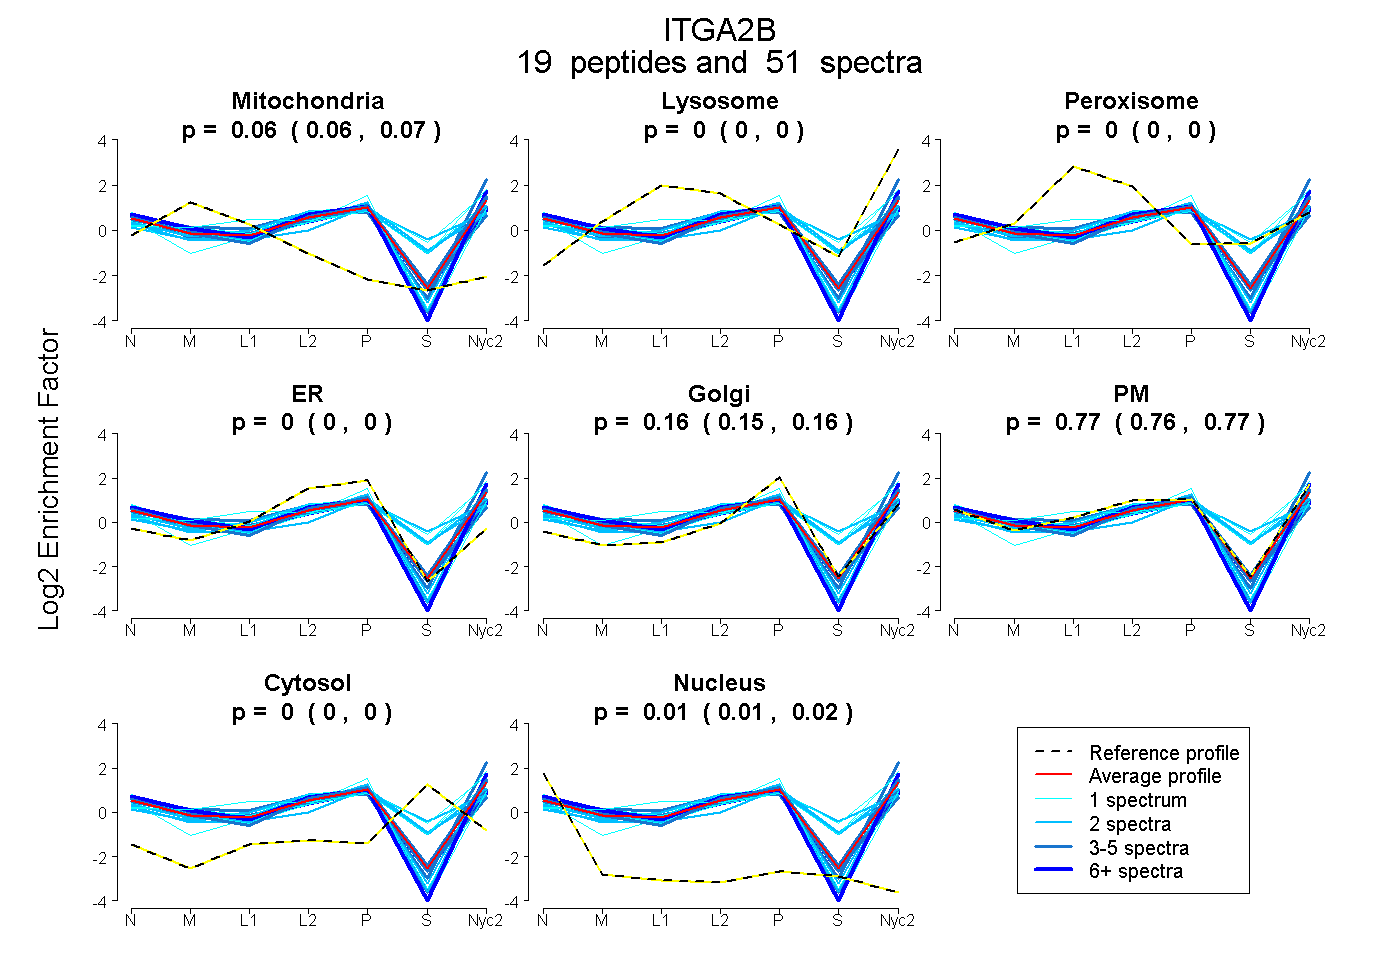
0.058 | 0.065
0.000 | 0.000
0.000 | 0.000
0.000 | 0.000
0.153 | 0.165
0.758 | 0.773
0.000 | 0.000
0.011 | 0.015
6peptides
spectra
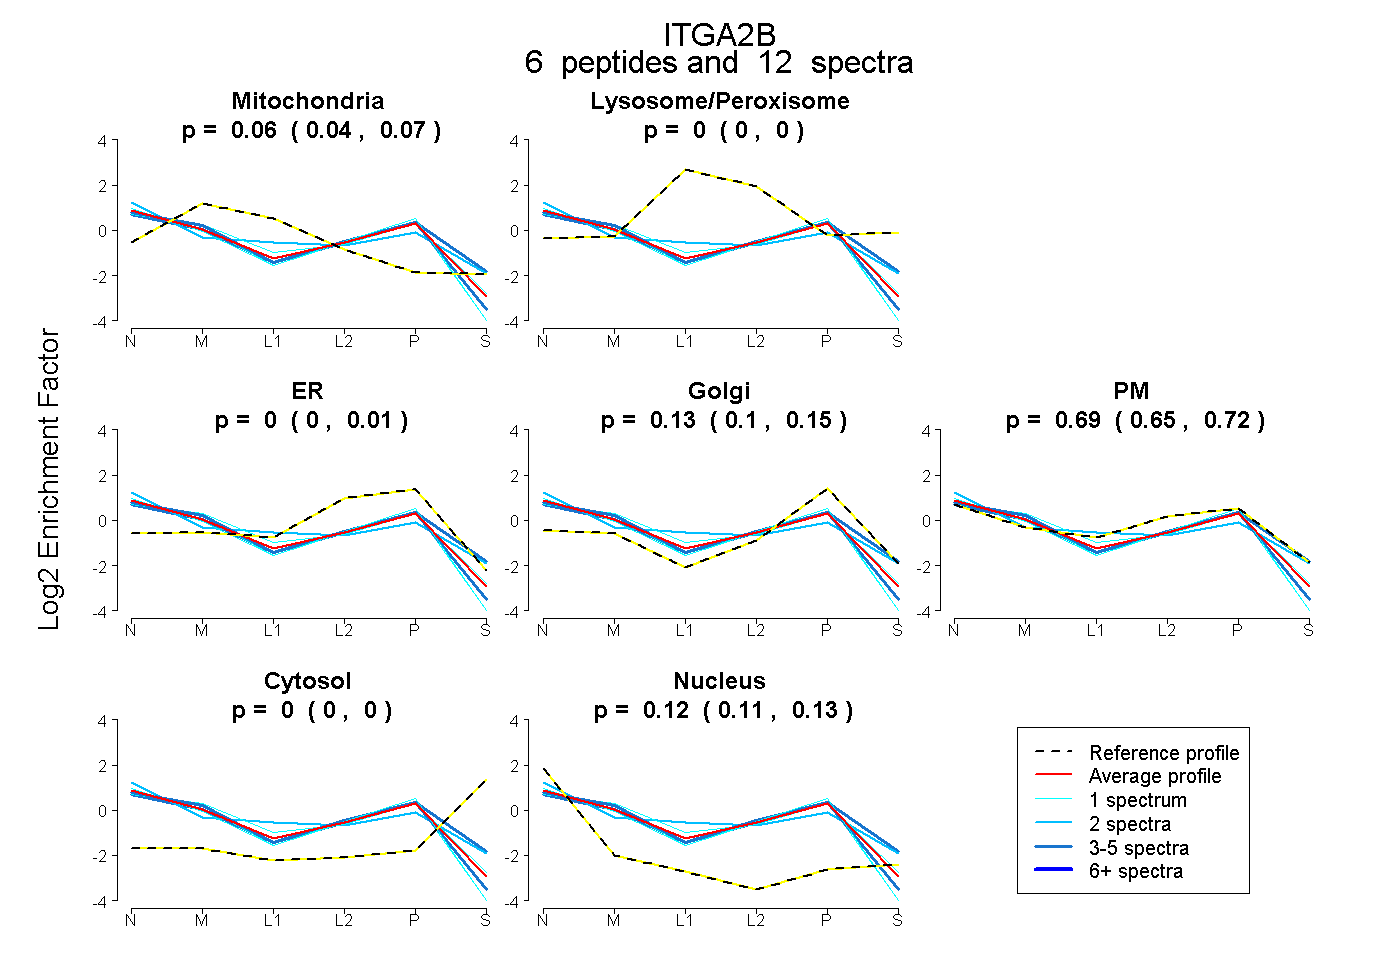
0.043 | 0.074
0.000 | 0.000
0.000 | 0.015
0.099 | 0.151
0.654 | 0.717
0.000 | 0.000
0.107 | 0.129
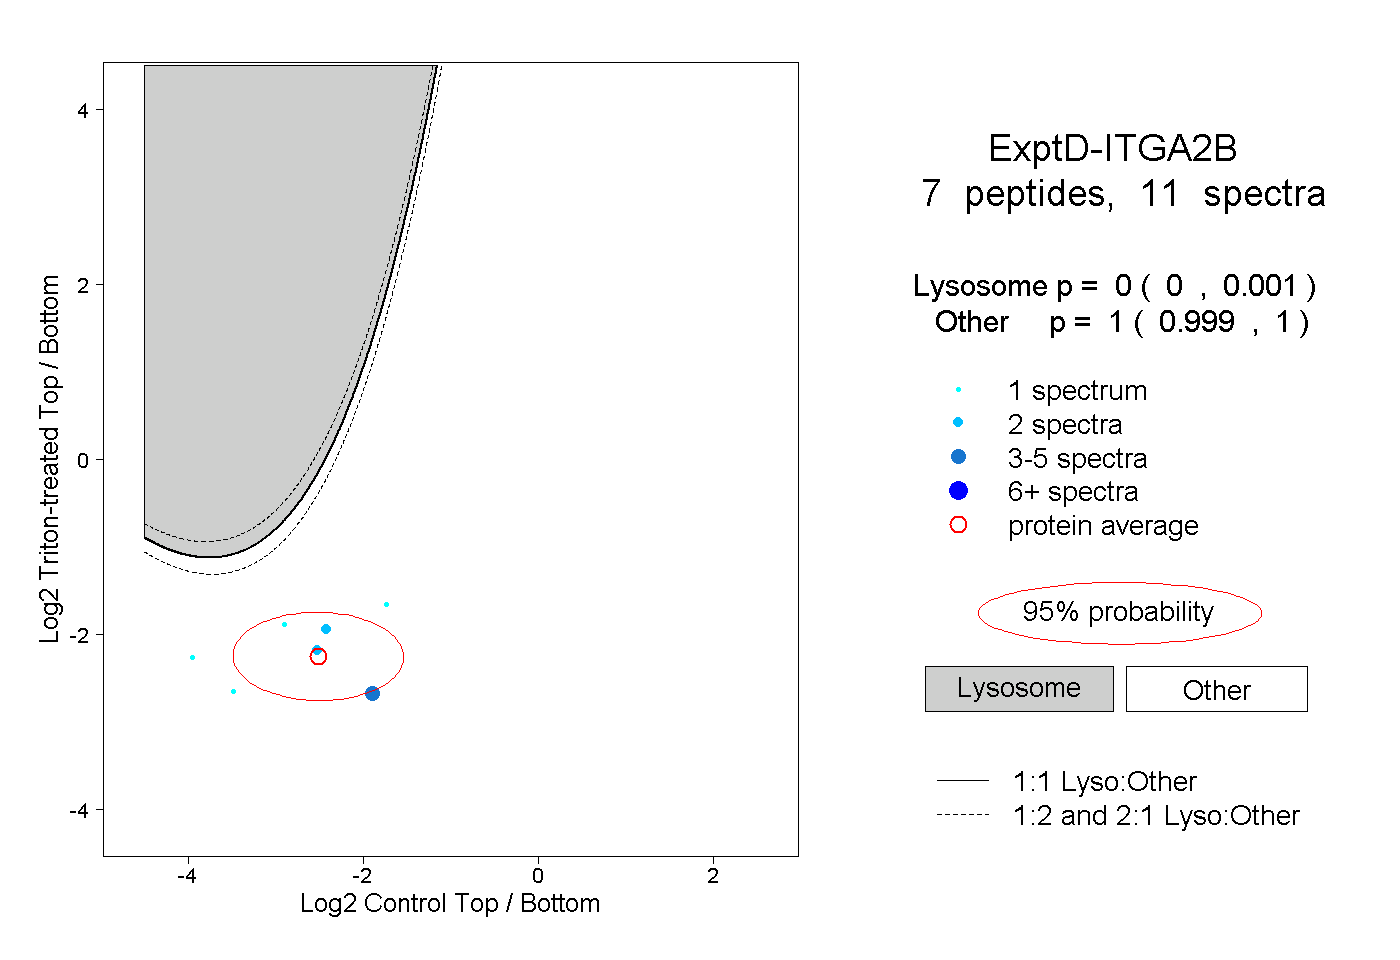
17peptides
spectra
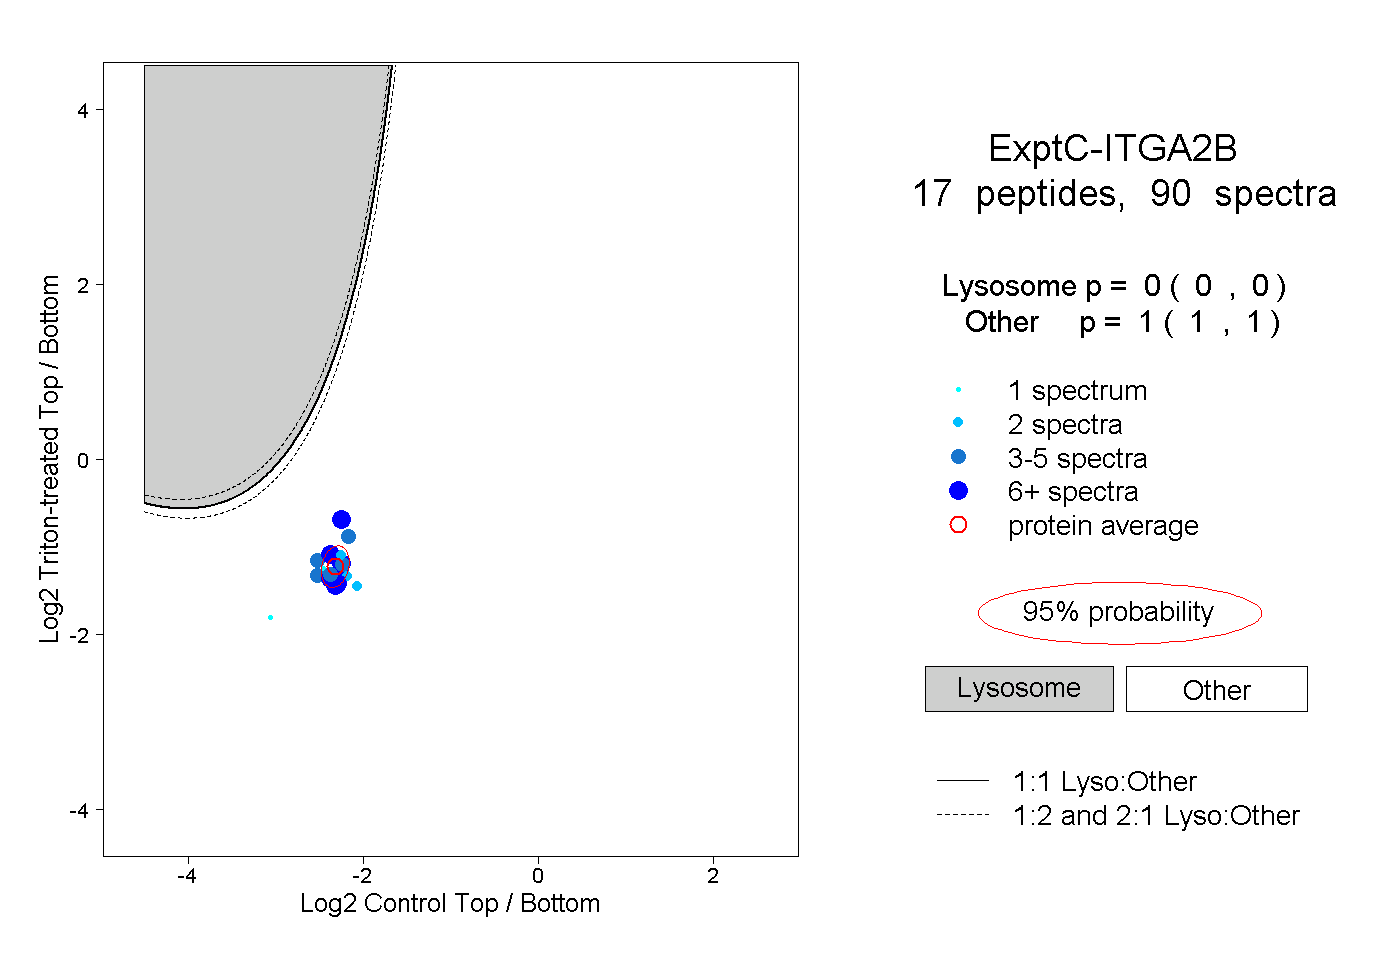
0.000 | 0.000
1.000 | 1.000