ITGA2B
[ENSRNOP00000052051]
Main page
| | | Plot |
Mito |
Lyso |
|
Perox |
ER |
Golgi |
PM |
Cytosol |
Nucleus |
|
| Expt A |
 19
19
peptides |
51
spectra |
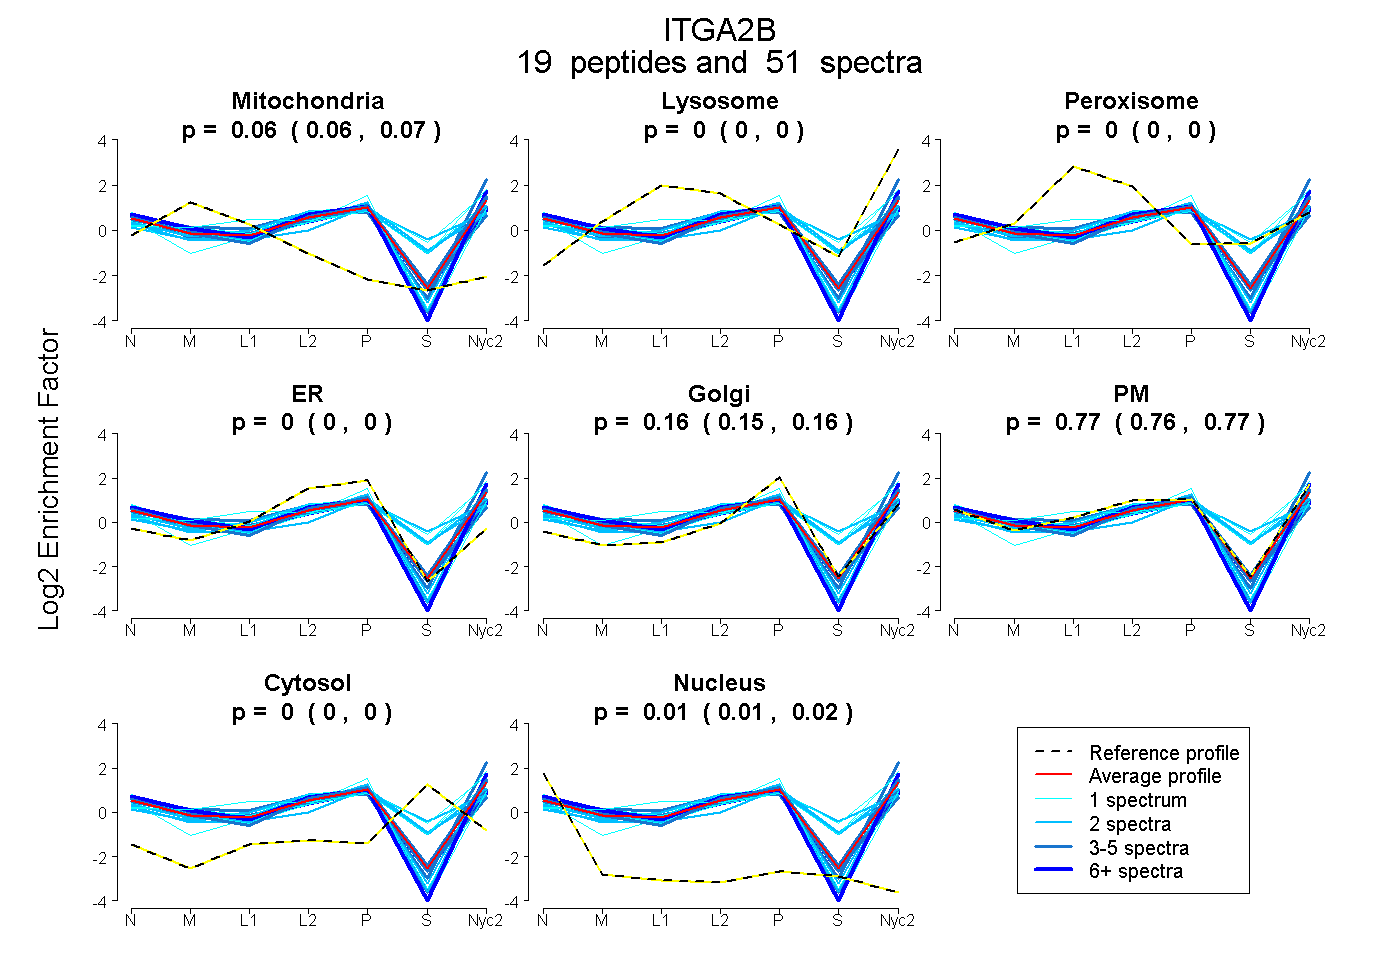 |
0.062
0.058 | 0.065 |
0.000
0.000 | 0.000 |
|
0.000
0.000 | 0.000 |
0.000
0.000 | 0.000 |
0.159
0.153 | 0.165 |
0.766
0.758 | 0.773 |
0.000
0.000 | 0.000 |
0.013
0.011 | 0.015 |
|
| | | Plot |
Mito |
|
Lyso or Perox |
|
ER |
Golgi |
PM |
Cytosol |
Nucleus |
|
| Expt B |
6
peptides |
12
spectra |
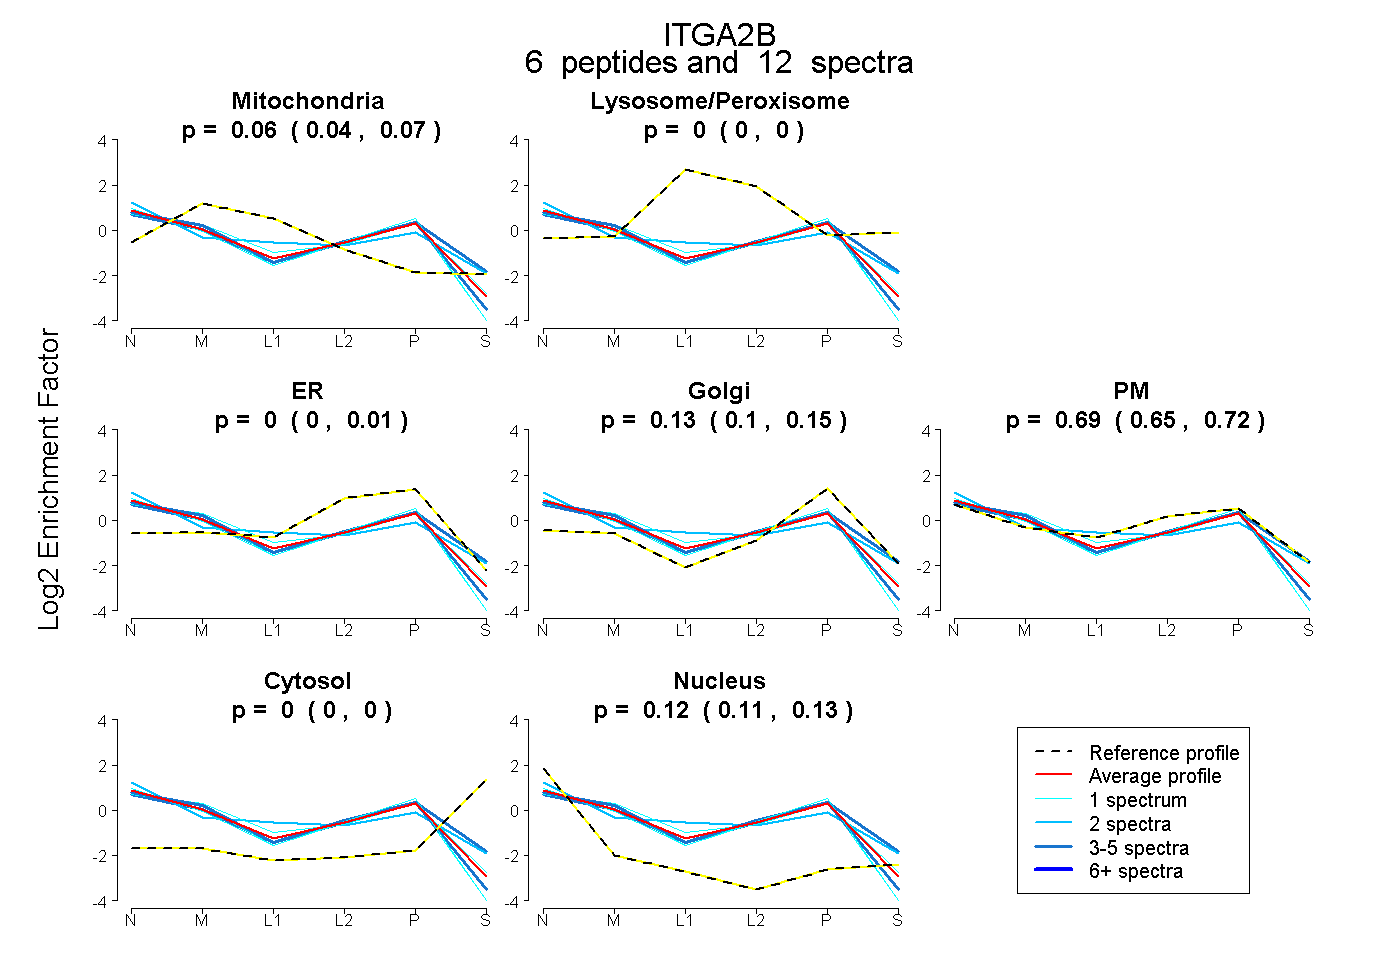 |
0.059
0.043 | 0.074 |
|
0.000
0.000 | 0.000 |
|
0.000
0.000 | 0.015 |
0.130
0.099 | 0.151 |
0.693
0.654 | 0.717 |
0.000
0.000 | 0.000 |
0.117
0.107 | 0.129 |
|
| 3 spectra, VLLLASR |
0.064 |
|
0.000 |
|
0.136 |
0.140 |
0.520 |
0.000 |
0.140 |
|
| 2 spectra, FGSAIAPLGDLNR |
0.065 |
|
0.056 |
|
0.000 |
0.000 |
0.699 |
0.000 |
0.179 |
|
| 1 spectrum, VYLFLQPK |
0.000 |
|
0.000 |
|
0.358 |
0.049 |
0.363 |
0.000 |
0.230 |
|
| 1 spectrum, NRPPLEEEEEEE |
0.020 |
|
0.000 |
|
0.333 |
0.065 |
0.358 |
0.000 |
0.224 |
|
| 1 spectrum, LAEVGR |
0.159 |
|
0.000 |
|
0.000 |
0.164 |
0.607 |
0.000 |
0.070 |
|
| 4 spectra, AEAAVELR |
0.068 |
|
0.000 |
|
0.000 |
0.232 |
0.614 |
0.000 |
0.086 |
|
| | | Plot |
|
Lyso |
|
|
|
|
|
|
|
Other |
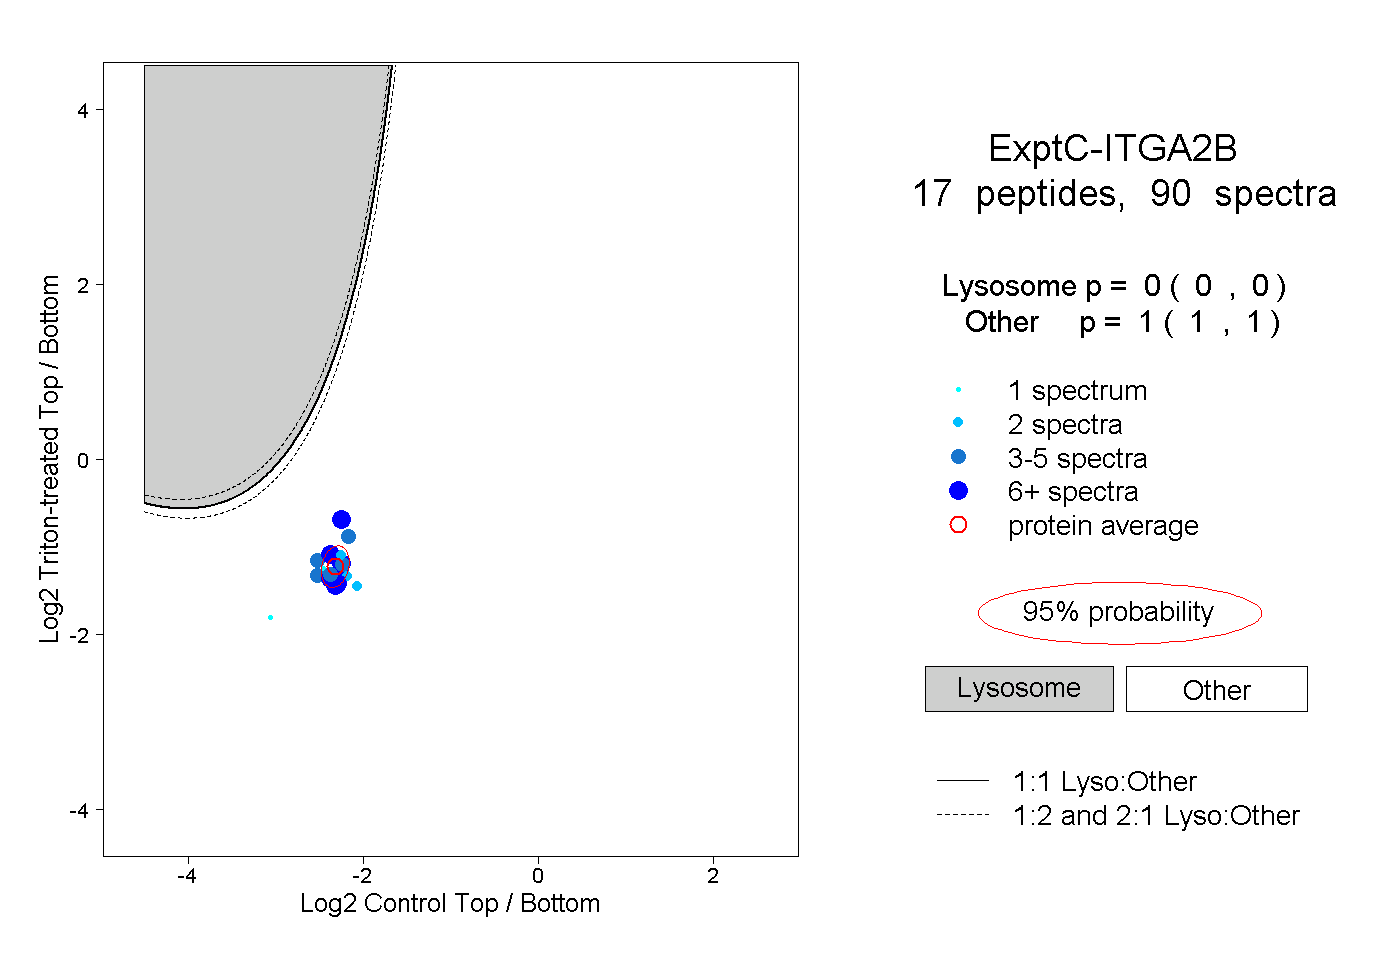
| Expt C |
17
peptides |
90
spectra |
 |
|
0.000
0.000 | 0.000 |
|
|
|
|
|
|
|
1.000
1.000 | 1.000 |
| | | Plot |
|
Lyso |
|
|
|
|
|
|
|
Other |
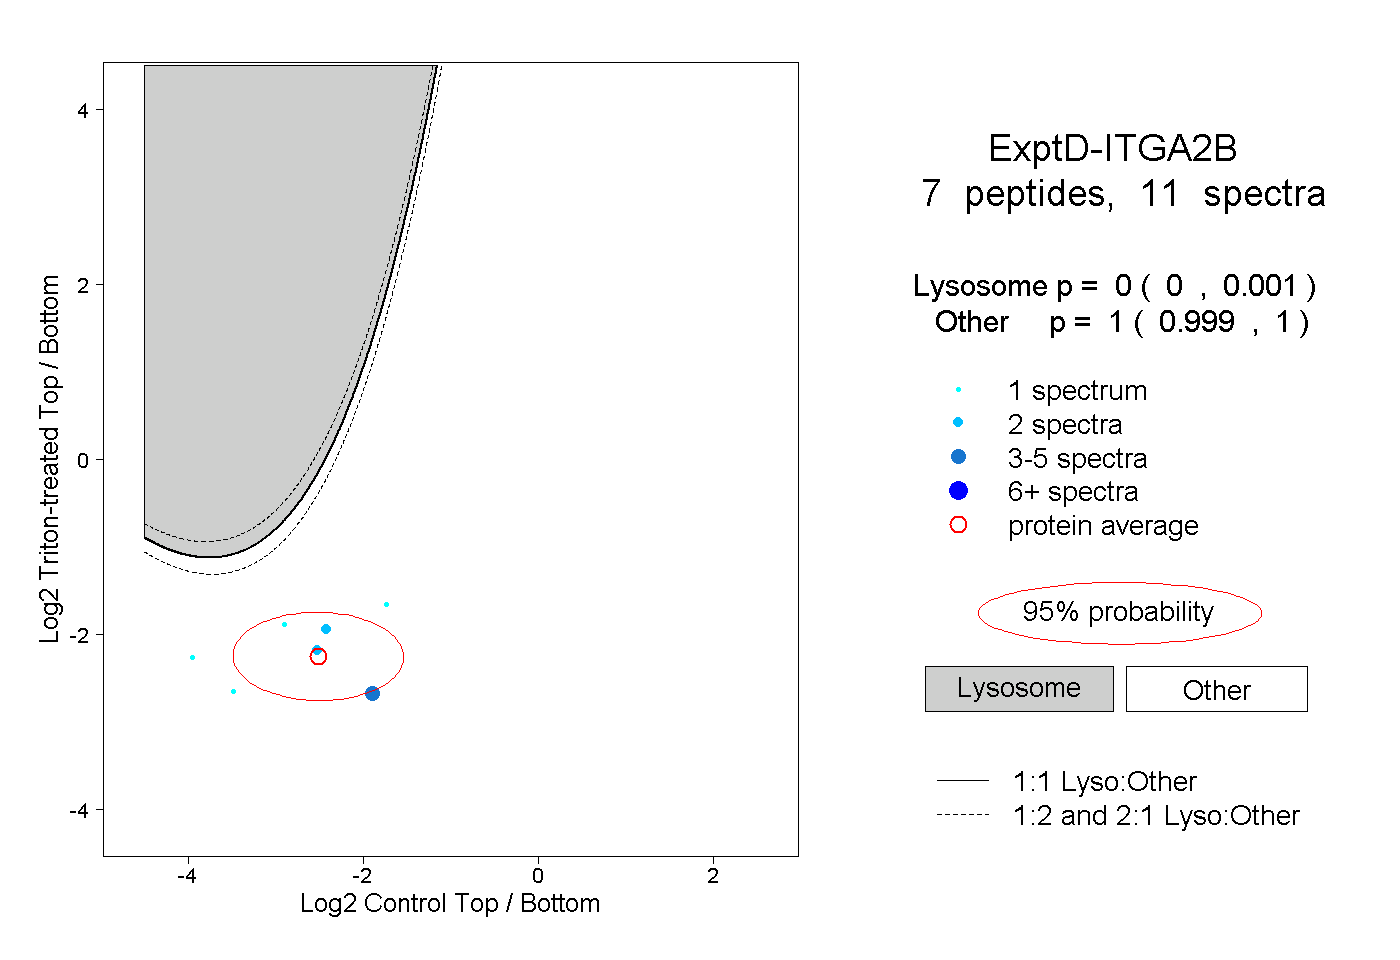
| Expt D |
7
peptides |
11
spectra |
 |
|
0.000
0.000 | 0.001 |
|
|
|
|
|
|
|
1.000
0.999 | 1.000 |