ZNFX1
[ENSRNOP00000052000]
Main page
| | | Plot |
Mito |
Lyso |
|
Perox |
ER |
Golgi |
PM |
Cytosol |
Nucleus |
|
| Expt A |
 15
15
peptides |
23
spectra |
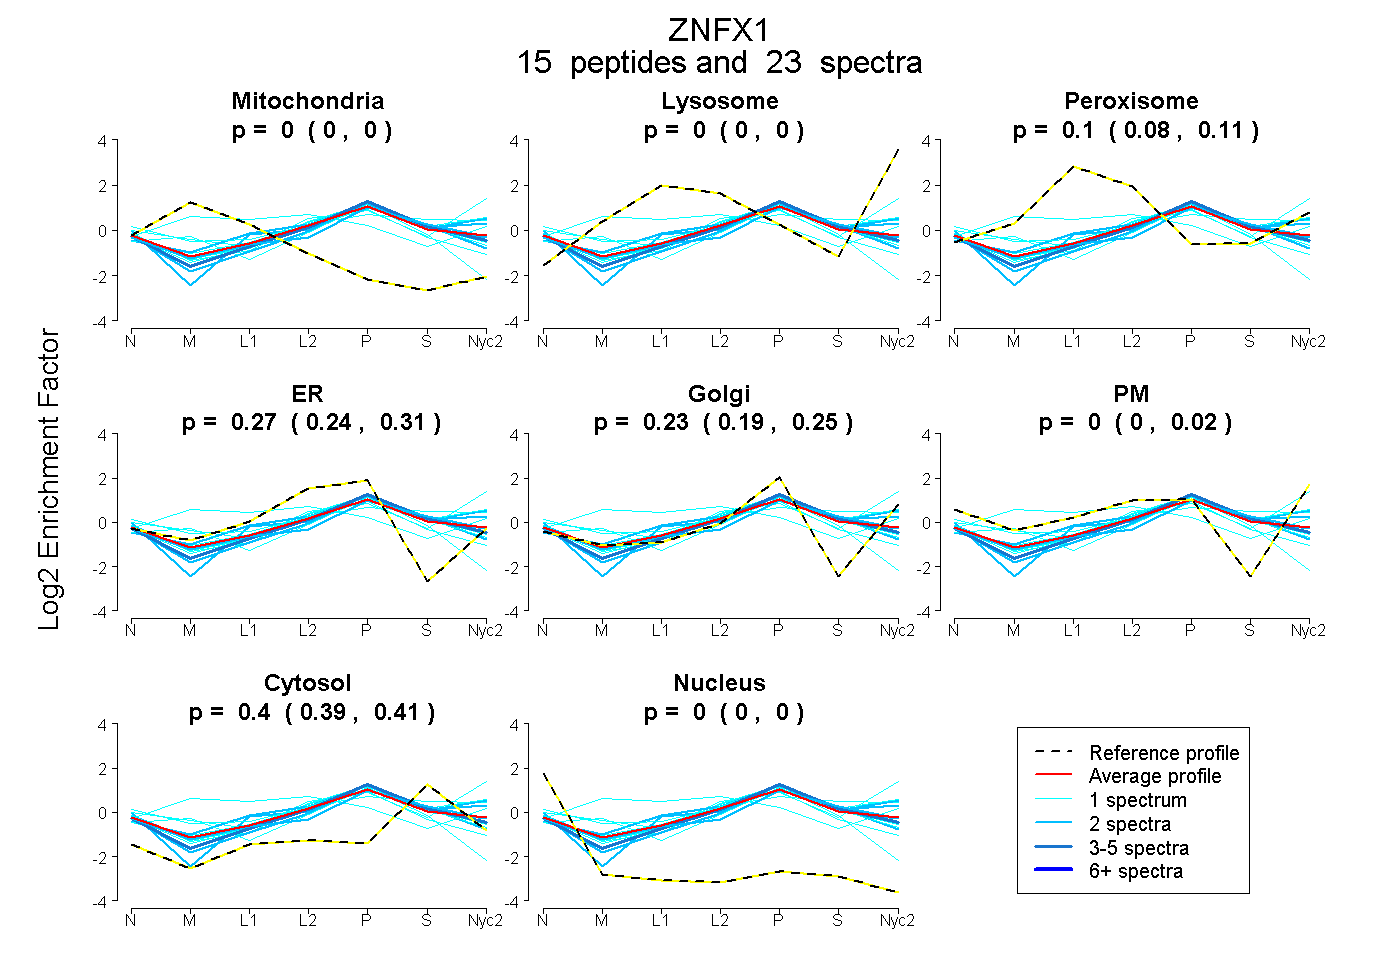 |
0.000
0.000 | 0.000 |
0.000
0.000 | 0.000 |
|
0.097
0.078 | 0.108 |
0.274
0.235 | 0.309 |
0.231
0.187 | 0.252 |
0.000
0.000 | 0.023 |
0.397
0.388 | 0.409 |
0.000
0.000 | 0.000 |
|
| | | Plot |
Mito |
|
Lyso or Perox |
|
ER |
Golgi |
PM |
Cytosol |
Nucleus |
|
| Expt B |
3
peptides |
4
spectra |
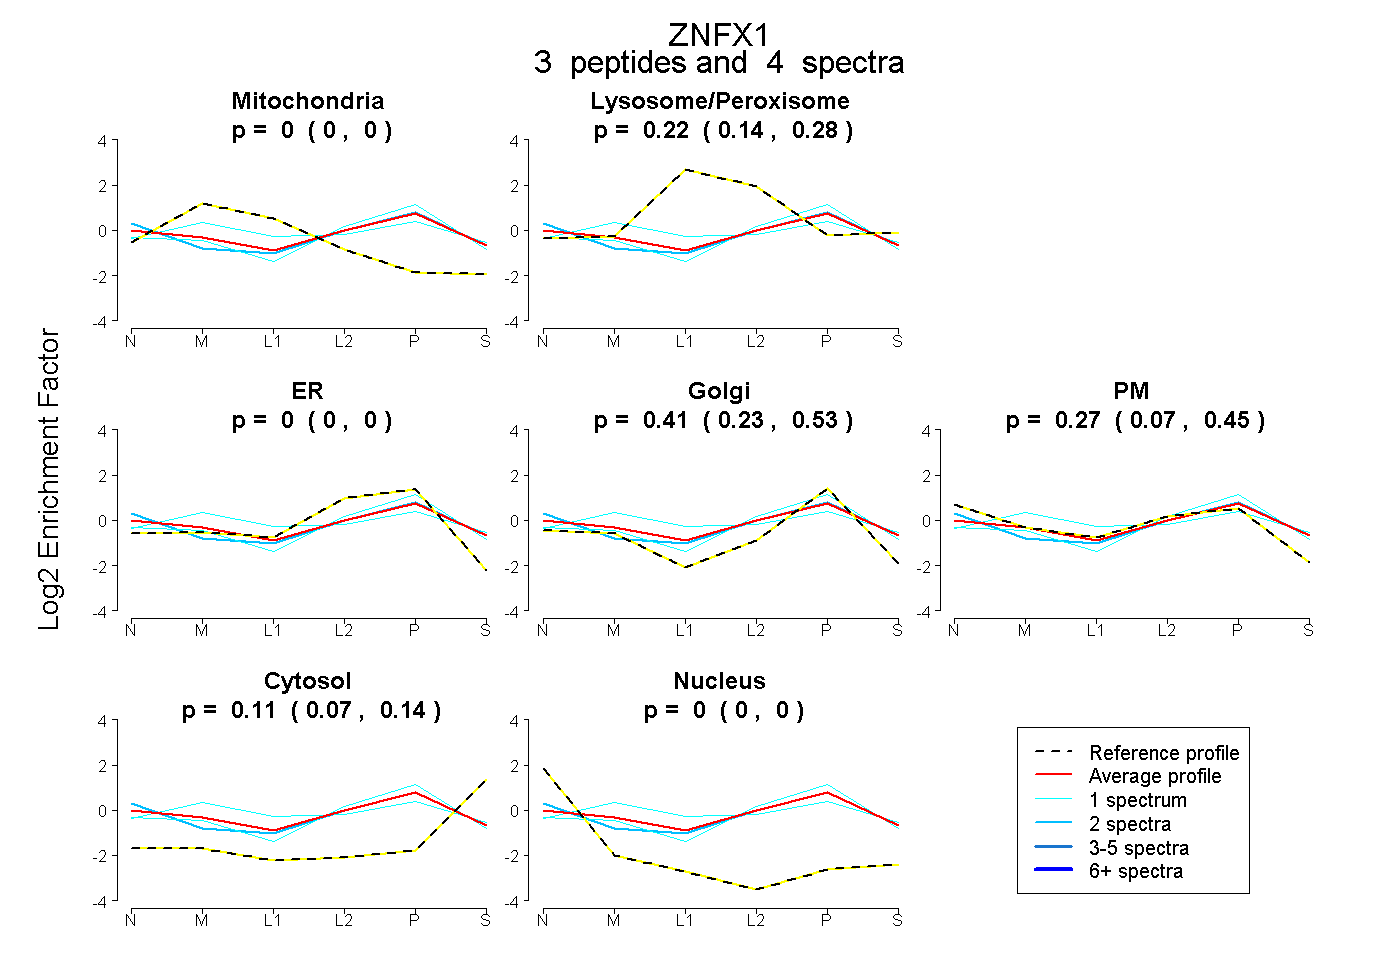 |
0.000
0.000 | 0.000 |
|
0.216
0.135 | 0.278 |
|
0.000
0.000 | 0.000 |
0.406
0.226 | 0.534 |
0.270
0.073 | 0.448 |
0.108
0.067 | 0.142 |
0.000
0.000 | 0.000 |
|
| 1 spectrum, QILQQVEPR |
0.151 |
|
0.318 |
|
0.000 |
0.440 |
0.000 |
0.091 |
0.000 |
|
| 2 spectra, ALQFALTR |
0.000 |
|
0.129 |
|
0.000 |
0.259 |
0.474 |
0.138 |
0.000 |
|
| 1 spectrum, VIEEEEVVRPR |
0.000 |
|
0.159 |
|
0.201 |
0.531 |
0.015 |
0.095 |
0.000 |
|
| | | Plot |
|
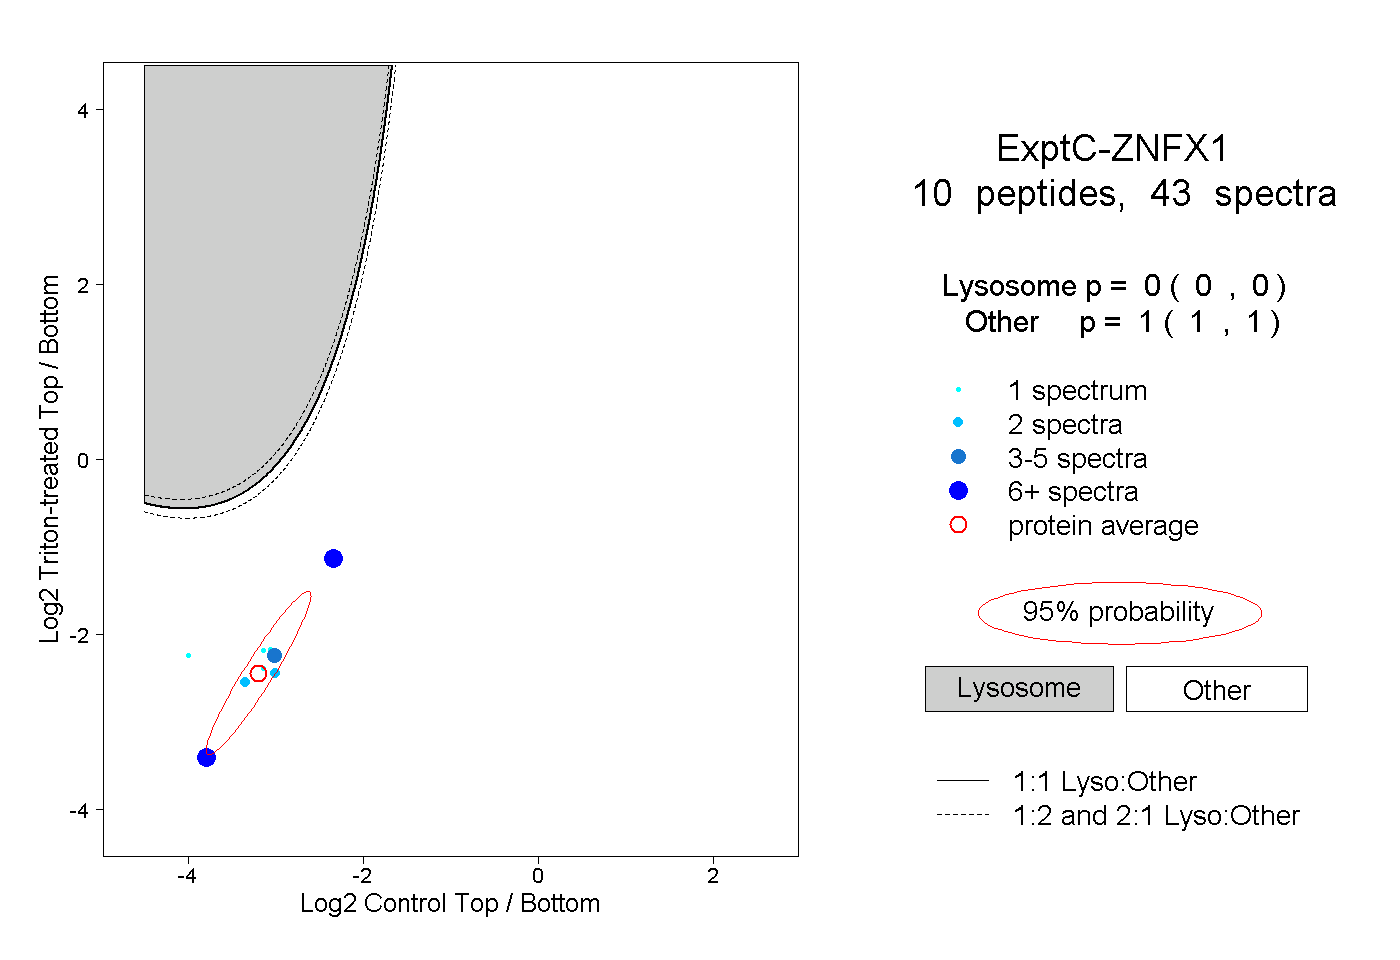
Lyso |
|
|
|
|
|
|
|
Other |
| Expt C |
10
peptides |
43
spectra |
 |
|
0.000
0.000 | 0.000 |
|
|
|
|
|
|
|
1.000
1.000 | 1.000 |
| | | Plot |
|
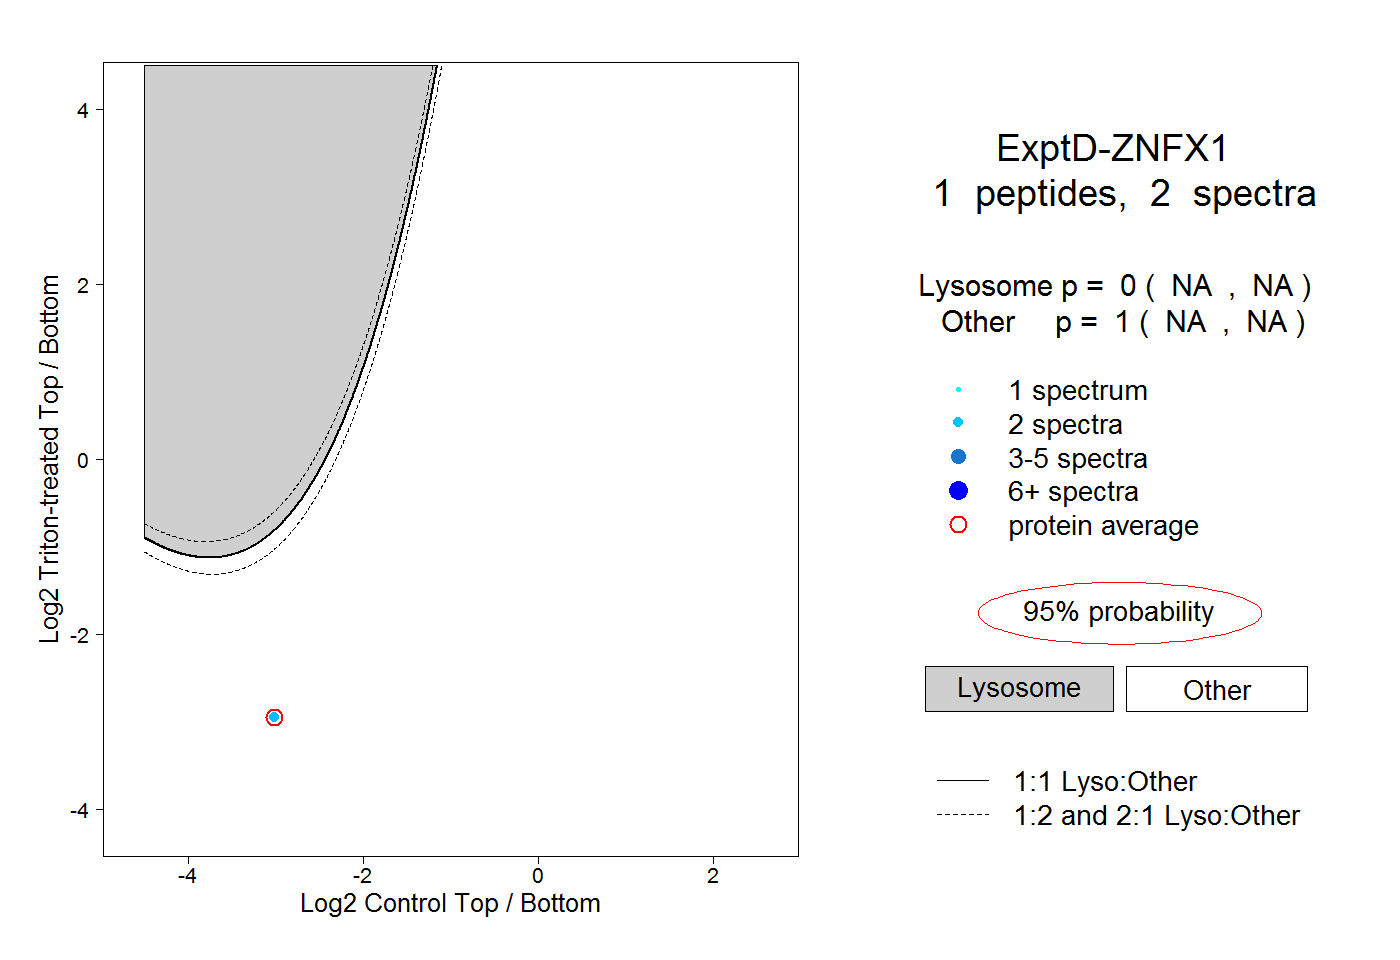
Lyso |
|
|
|
|
|
|
|
Other |
| Expt D |
1
peptide |
2
spectra |
 |
|
0.000
NA | NA |
|
|
|
|
|
|
|
1.000
NA | NA |