 15
15peptides
spectra
0.000 | 0.000
0.000 | 0.000
0.078 | 0.108
0.235 | 0.309
0.187 | 0.252
0.000 | 0.023
0.388 | 0.409
0.000 | 0.000
| Plot | Mito | Lyso | Perox | ER | Golgi | PM | Cytosol | Nucleus | |||||
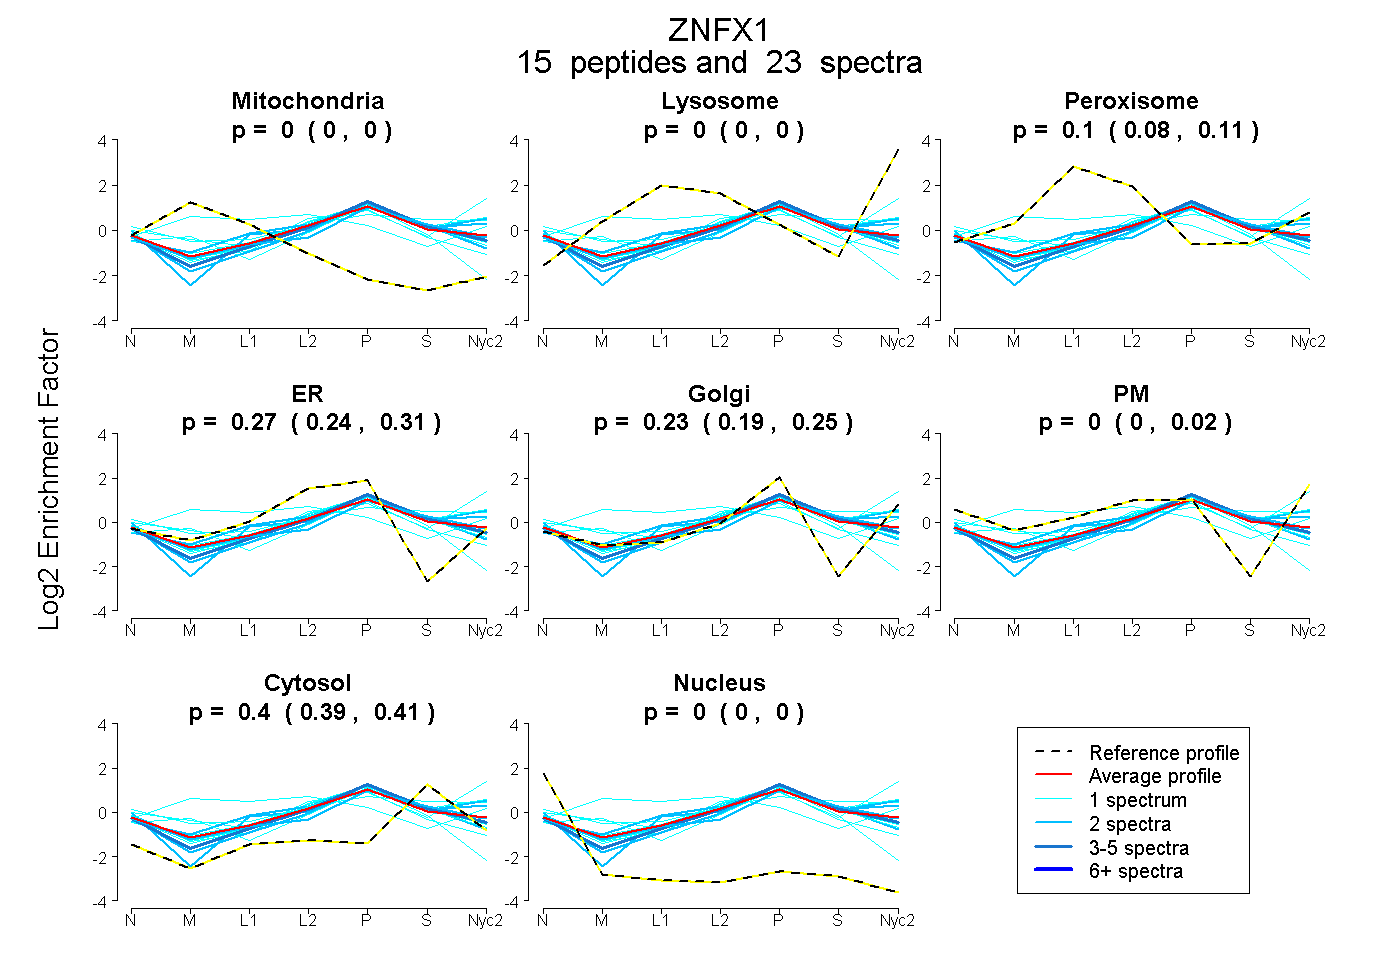
| Expt A |
15 peptides |
23 spectra |
|
0.000 0.000 | 0.000 |
0.000 0.000 | 0.000 |
0.097 0.078 | 0.108 |
0.274 0.235 | 0.309 |
0.231 0.187 | 0.252 |
0.000 0.000 | 0.023 |
0.397 0.388 | 0.409 |
0.000 0.000 | 0.000 |
| 1 spectrum, LGFSSQELSDLQSEIQR | 0.000 | 0.040 | 0.008 | 0.042 | 0.221 | 0.283 | 0.405 | 0.000 | ||
| 1 spectrum, IQGSAGEIAASQER | 0.000 | 0.000 | 0.000 | 0.462 | 0.088 | 0.008 | 0.443 | 0.000 | ||
| 2 spectra, ALQFALTR | 0.000 | 0.000 | 0.056 | 0.319 | 0.219 | 0.000 | 0.406 | 0.000 | ||
| 2 spectra, VQIVTALGVPR | 0.000 | 0.000 | 0.095 | 0.108 | 0.346 | 0.000 | 0.451 | 0.000 | ||
| 4 spectra, VIEEEEVVRPR | 0.000 | 0.000 | 0.000 | 0.409 | 0.128 | 0.000 | 0.463 | 0.000 | ||
| 1 spectrum, STCPECQEVIGGENHTLER | 0.109 | 0.000 | 0.000 | 0.462 | 0.000 | 0.000 | 0.394 | 0.034 | ||
| 2 spectra, MLLAMR | 0.000 | 0.000 | 0.000 | 0.380 | 0.118 | 0.000 | 0.502 | 0.000 | ||
| 2 spectra, LQVGAQTLECTMHGVLR | 0.000 | 0.000 | 0.250 | 0.009 | 0.441 | 0.000 | 0.301 | 0.000 | ||
| 1 spectrum, DNFETFLFATVSNR | 0.000 | 0.089 | 0.124 | 0.034 | 0.238 | 0.085 | 0.430 | 0.000 | ||
| 1 spectrum, TTLPCSGLGISEEER | 0.000 | 0.000 | 0.000 | 0.505 | 0.026 | 0.000 | 0.469 | 0.000 | ||
| 1 spectrum, VNVPFVR | 0.089 | 0.000 | 0.044 | 0.522 | 0.000 | 0.000 | 0.345 | 0.000 | ||
| 1 spectrum, HVLEGLQEVQEEDVPFQR | 0.159 | 0.000 | 0.435 | 0.000 | 0.290 | 0.033 | 0.082 | 0.000 | ||
| 2 spectra, EALNLDDSQMK | 0.000 | 0.000 | 0.054 | 0.049 | 0.311 | 0.178 | 0.409 | 0.000 | ||
| 1 spectrum, IIHTIR | 0.000 | 0.000 | 0.009 | 0.522 | 0.024 | 0.000 | 0.445 | 0.000 | ||
| 1 spectrum, IVQALLTNK | 0.000 | 0.136 | 0.000 | 0.000 | 0.091 | 0.483 | 0.290 | 0.000 |
| Plot | Mito | Lyso or Perox | ER | Golgi | PM | Cytosol | Nucleus | ||||||
| Expt B |
3 peptides |
4 spectra |
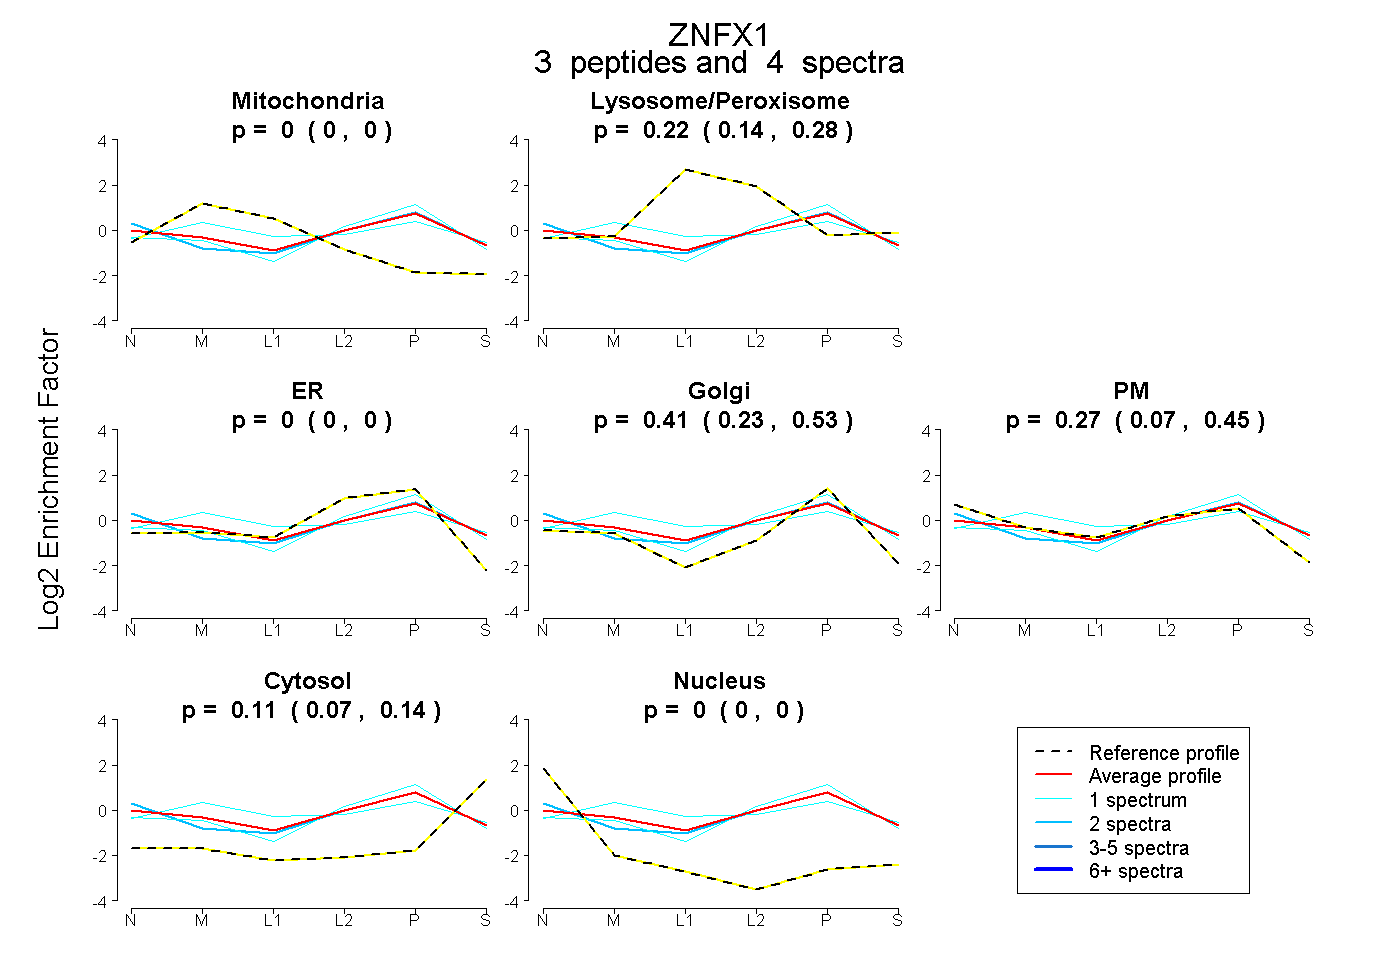 |
0.000 0.000 | 0.000 |
0.216 0.135 | 0.278 |
0.000 0.000 | 0.000 |
0.406 0.226 | 0.534 |
0.270 0.073 | 0.448 |
0.108 0.067 | 0.142 |
0.000 0.000 | 0.000 |
|||
| Plot | Lyso | Other | |||||||||||
| Expt C |
10 peptides |
43 spectra |
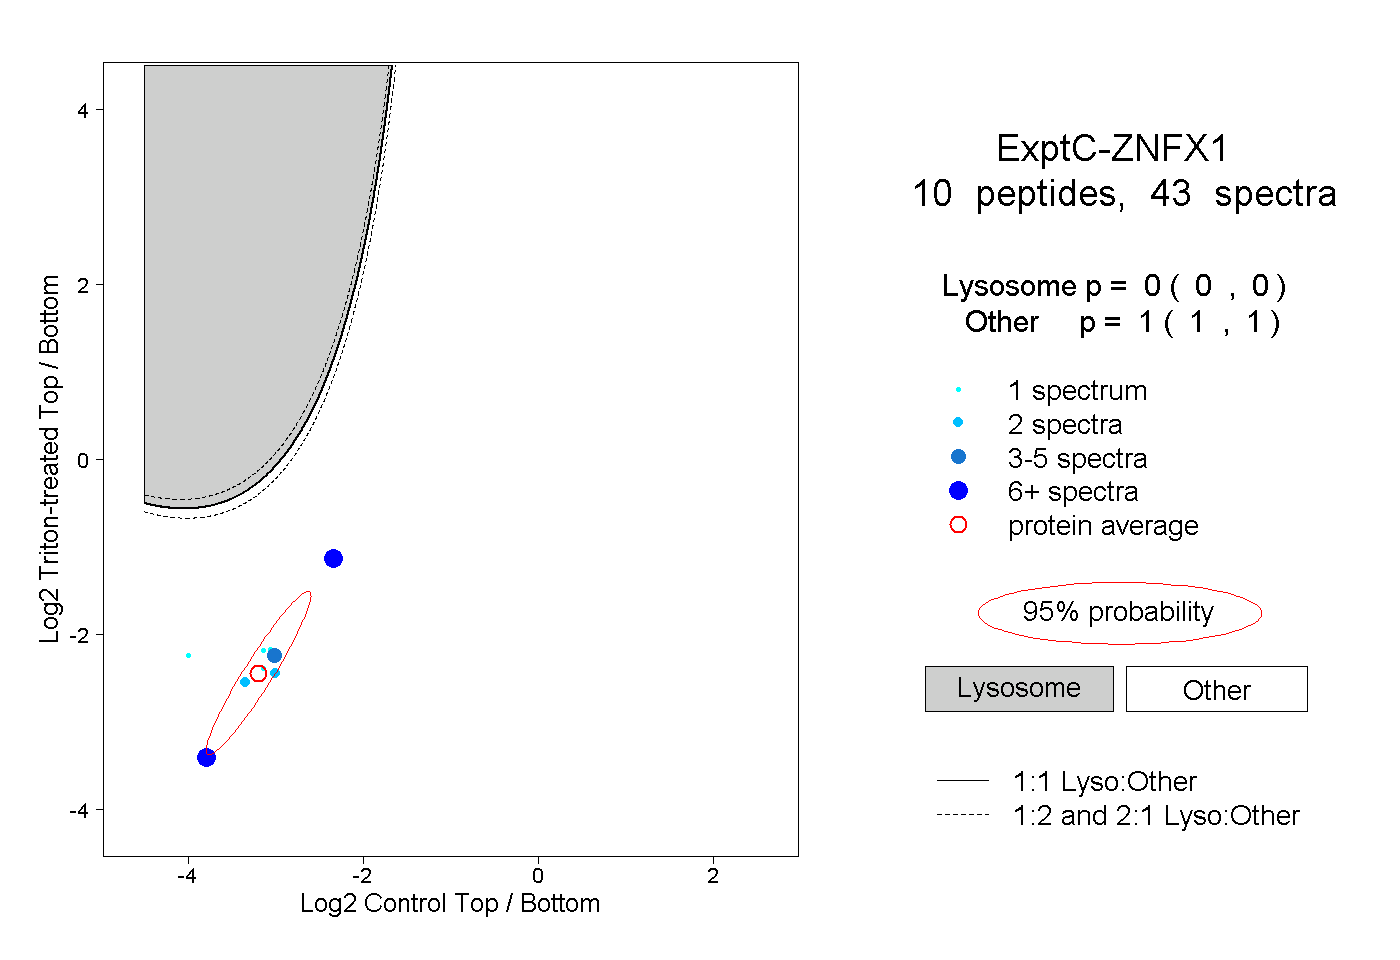 |
0.000 0.000 | 0.000 |
1.000 1.000 | 1.000 |
||||||||
| Plot | Lyso | Other | |||||||||||
| Expt D |
1 peptide |
2 spectra |
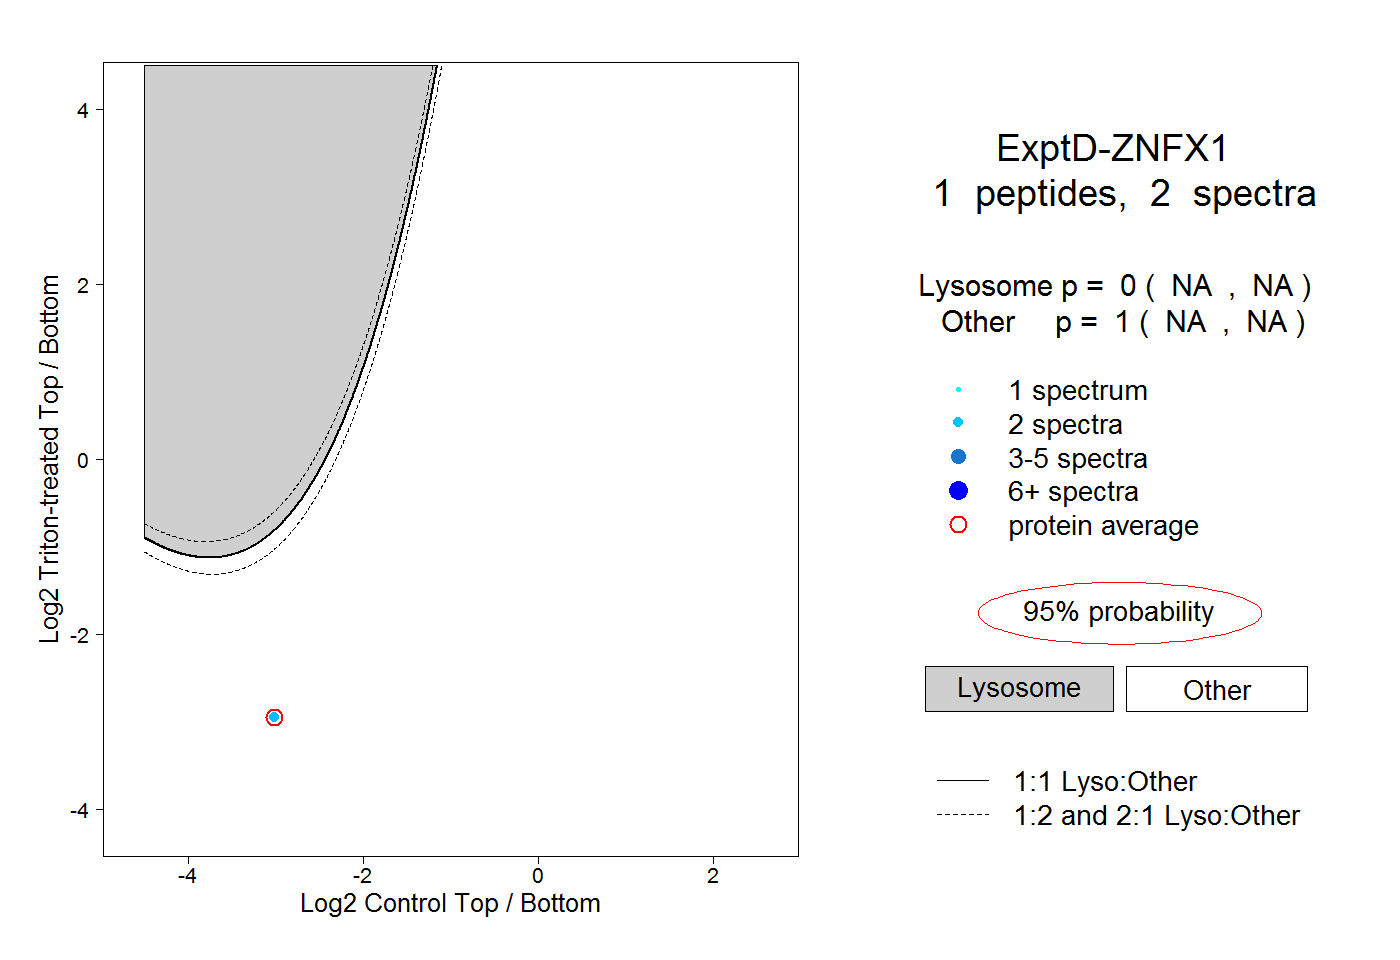 |
0.000 NA | NA |
1.000 NA | NA |