 7
7peptides
spectra
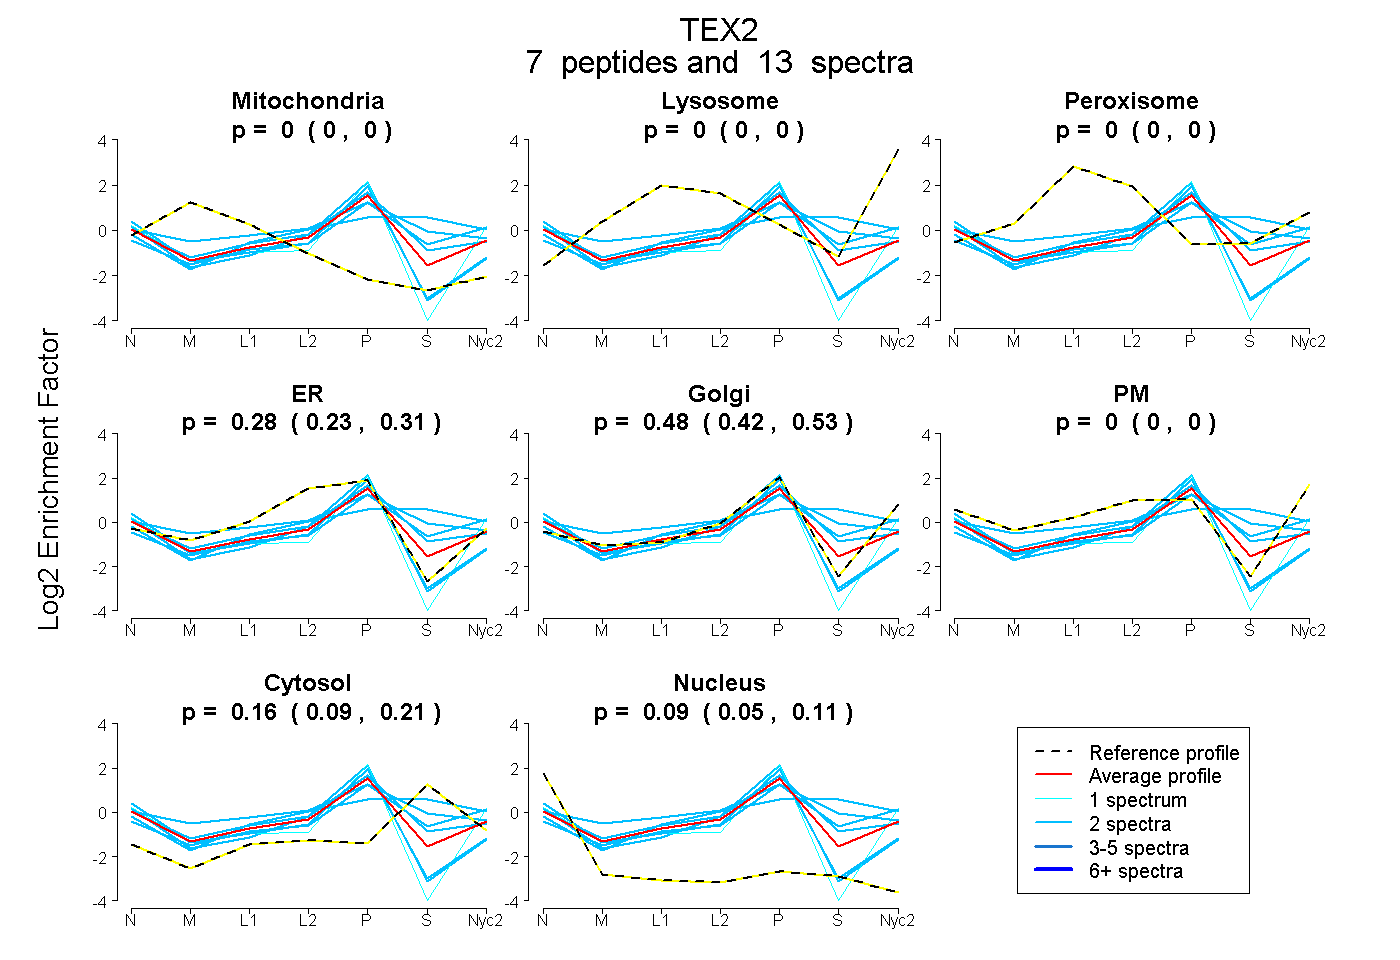
0.000 | 0.000
0.000 | 0.000
0.000 | 0.000
0.235 | 0.312
0.422 | 0.532
0.000 | 0.000
0.094 | 0.213
0.051 | 0.112
| Plot | Mito | Lyso | Perox | ER | Golgi | PM | Cytosol | Nucleus | |||||
| Expt A |
7 peptides |
13 spectra |
|
0.000 0.000 | 0.000 |
0.000 0.000 | 0.000 |
0.000 0.000 | 0.000 |
0.275 0.235 | 0.312 |
0.481 0.422 | 0.532 |
0.000 0.000 | 0.000 |
0.158 0.094 | 0.213 |
0.085 0.051 | 0.112 |
| 2 spectra, QPLPGAEGYVGGHR | 0.000 | 0.000 | 0.197 | 0.061 | 0.485 | 0.046 | 0.211 | 0.000 | ||
| 2 spectra, MWYGFR | 0.000 | 0.000 | 0.000 | 0.132 | 0.417 | 0.000 | 0.451 | 0.000 | ||
| 2 spectra, DPILYLFGR | 0.000 | 0.000 | 0.000 | 0.468 | 0.329 | 0.000 | 0.000 | 0.203 | ||
| 2 spectra, IEDTK | 0.000 | 0.000 | 0.059 | 0.139 | 0.039 | 0.222 | 0.541 | 0.000 | ||
| 2 spectra, FTLASK | 0.000 | 0.000 | 0.000 | 0.345 | 0.369 | 0.000 | 0.272 | 0.014 | ||
| 2 spectra, SSGVSGSK | 0.000 | 0.000 | 0.000 | 0.379 | 0.397 | 0.000 | 0.000 | 0.224 | ||
| 1 spectrum, IFWDFLGEK | 0.000 | 0.000 | 0.000 | 0.000 | 0.880 | 0.000 | 0.000 | 0.120 |
| Plot | Mito | Lyso or Perox | ER | Golgi | PM | Cytosol | Nucleus | ||||||
| Expt B |
1 peptide |
1 spectrum |
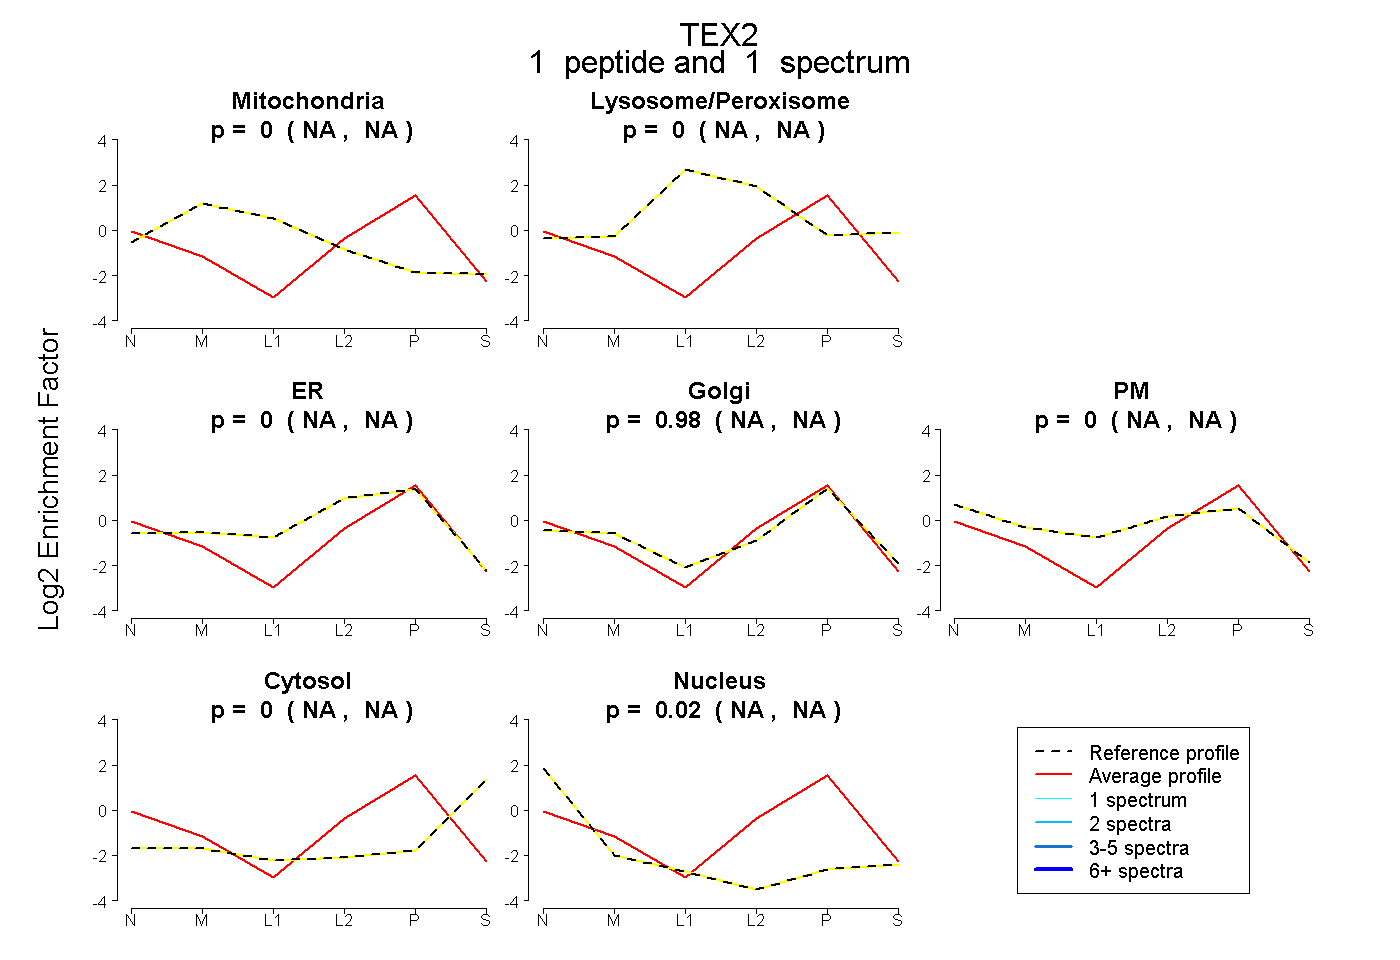 |
0.000 NA | NA |
0.000 NA | NA |
0.000 NA | NA |
0.983 NA | NA |
0.000 NA | NA |
0.000 NA | NA |
0.017 NA | NA |
|||
| Plot | Lyso | Other | |||||||||||
| Expt C |
2 peptides |
9 spectra |
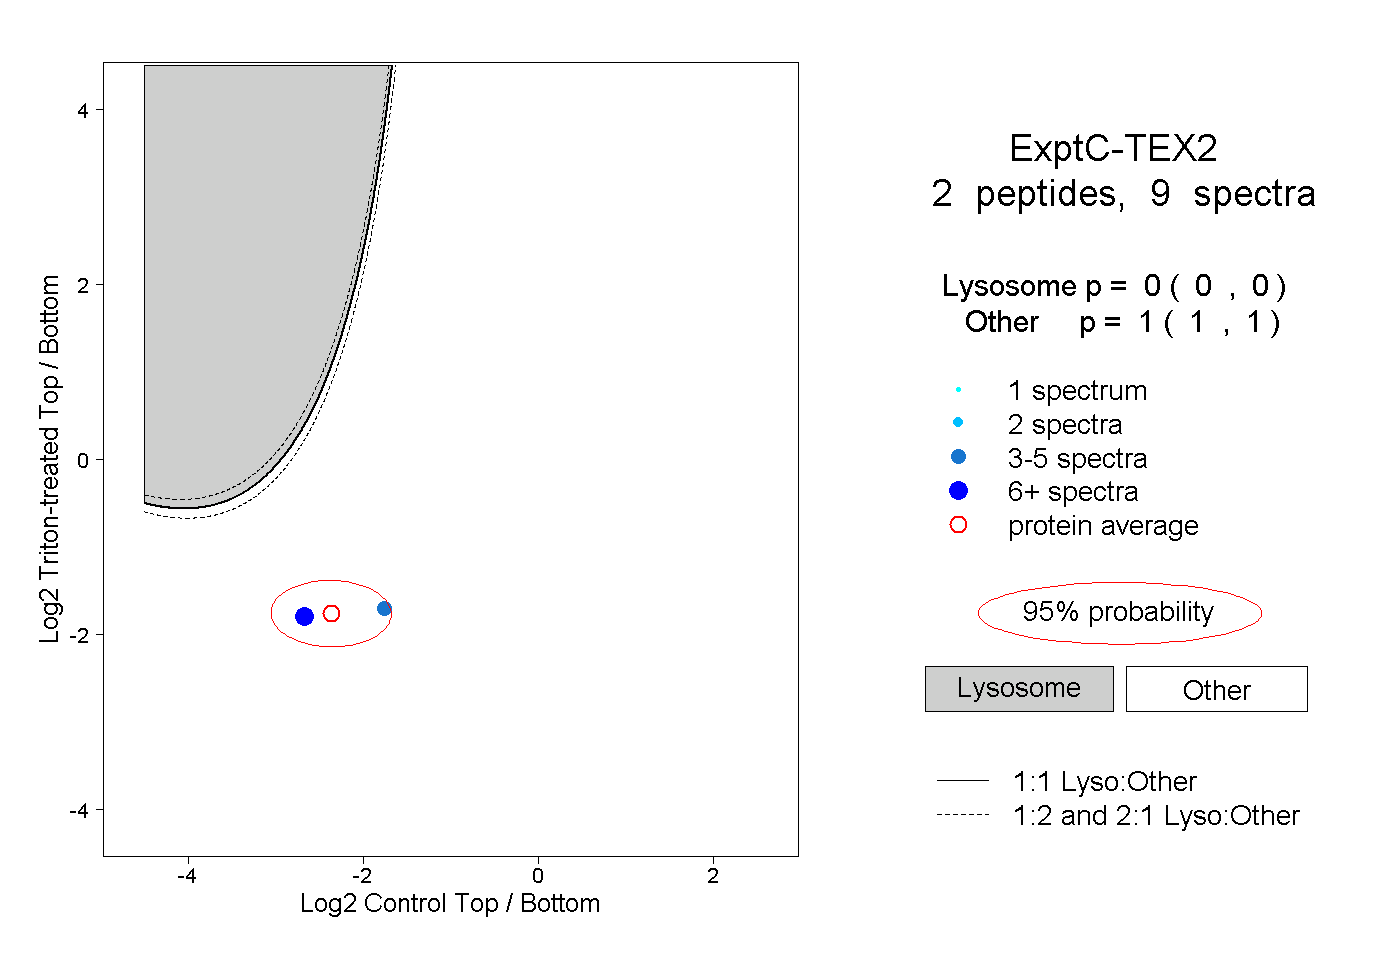 |
0.000 0.000 | 0.000 |
1.000 1.000 | 1.000 |