 10
10peptides
spectra
0.000 | 0.000
0.000 | 0.000
0.130 | 0.177
0.081 | 0.122
0.000 | 0.000
0.000 | 0.000
0.339 | 0.373
0.364 | 0.396
5peptides
spectra
0.000 | 0.000
1.000 | 1.000
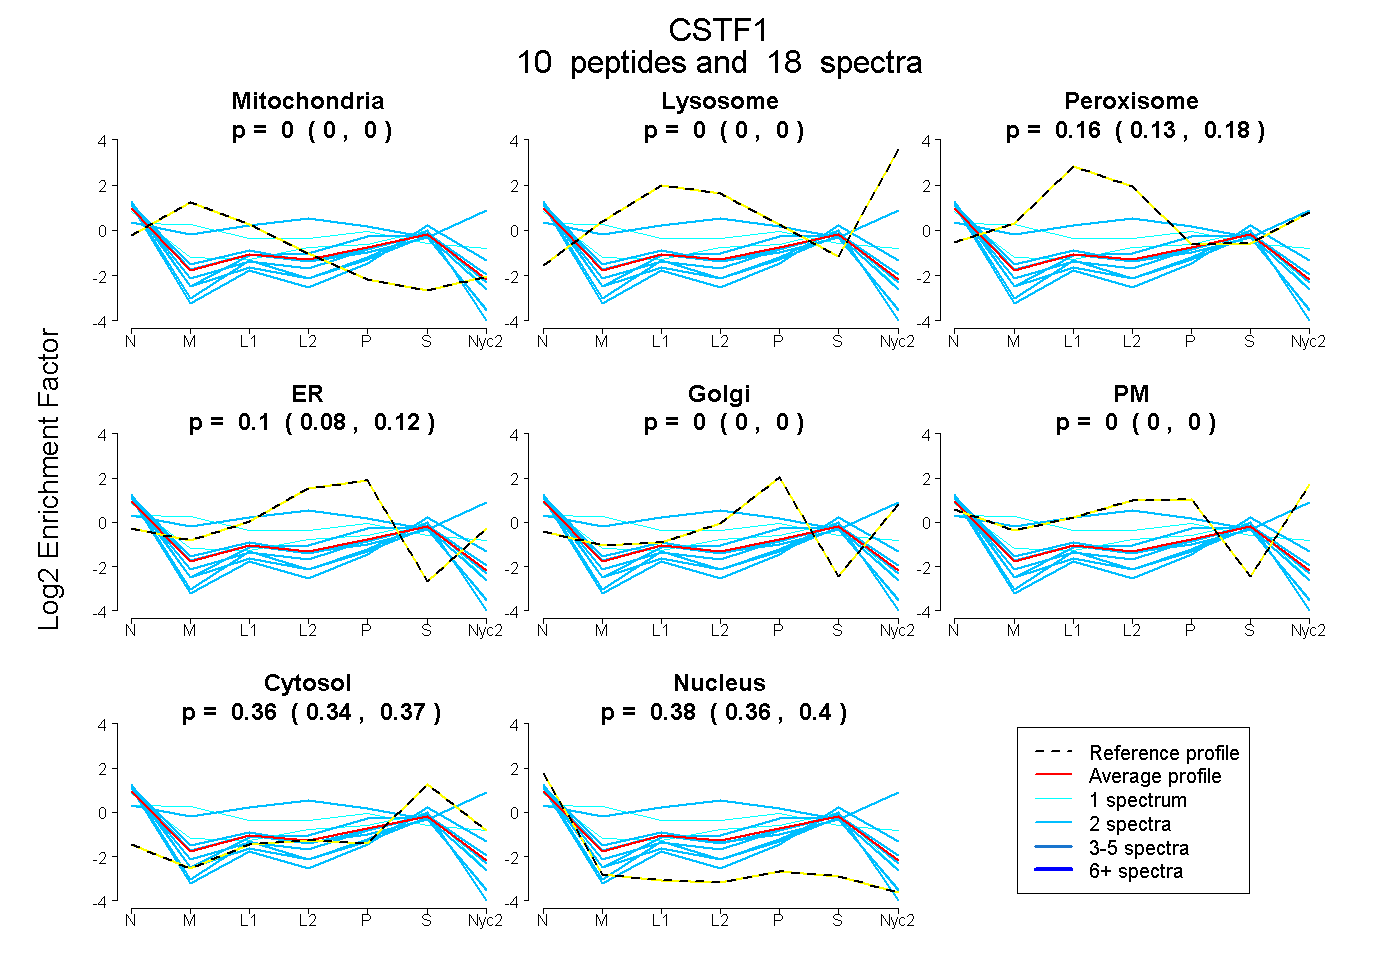
| Plot | Mito | Lyso | Perox | ER | Golgi | PM | Cytosol | Nucleus | |||||
| Expt A |
10 peptides |
18 spectra |
|
0.000 0.000 | 0.000 |
0.000 0.000 | 0.000 |
0.157 0.130 | 0.177 |
0.103 0.081 | 0.122 |
0.000 0.000 | 0.000 |
0.000 0.000 | 0.000 |
0.358 0.339 | 0.373 |
0.382 0.364 | 0.396 |
||
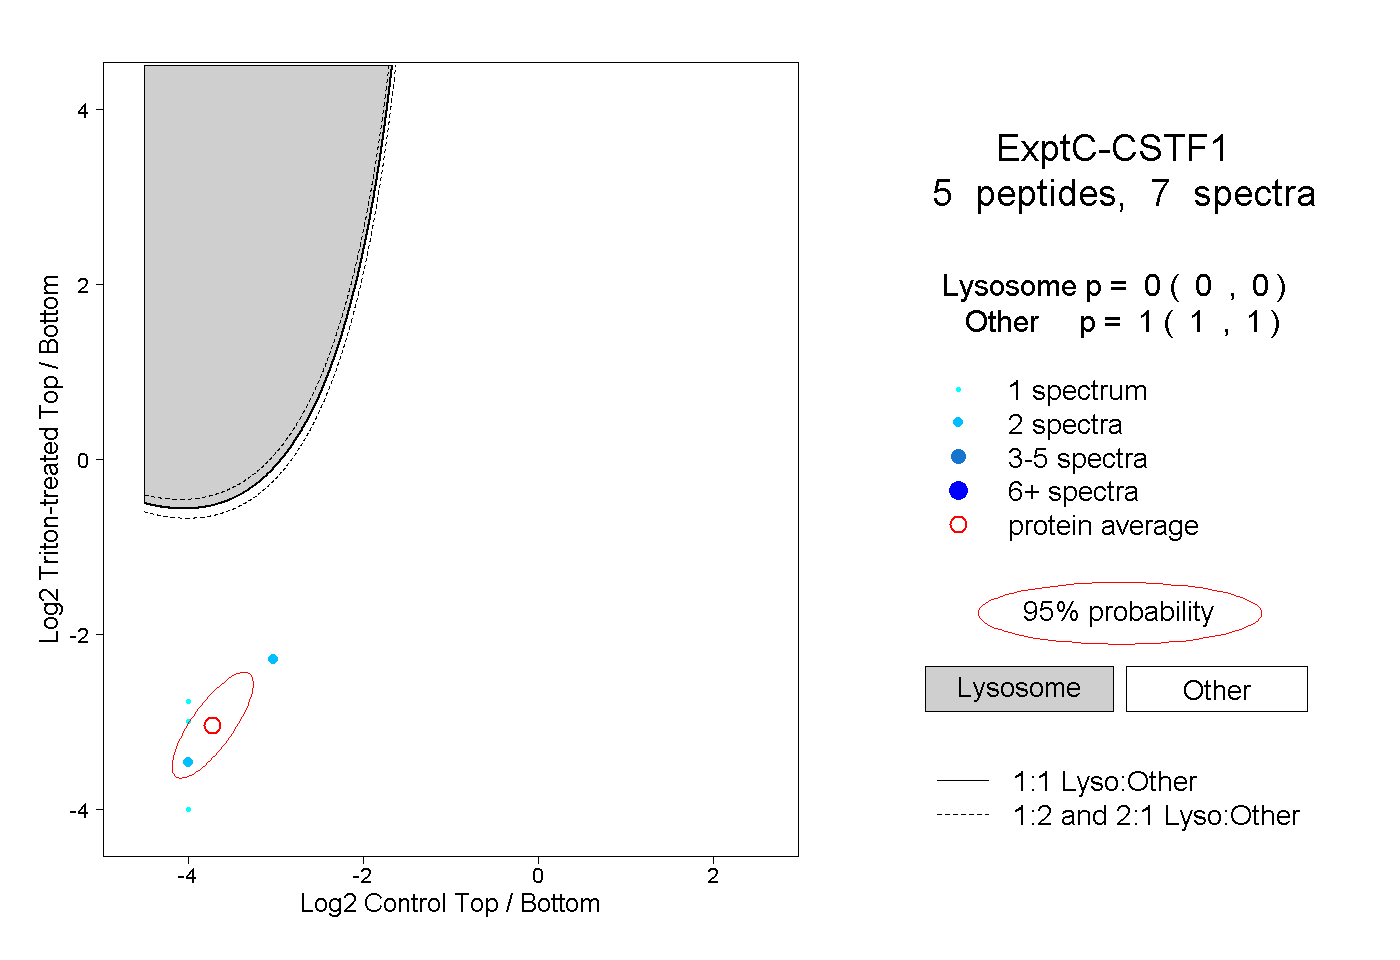
| Plot | Lyso | Other | |||||||||||
| Expt C |
5 peptides |
7 spectra |
|
0.000 0.000 | 0.000 |
1.000 1.000 | 1.000 |