12
12peptides
spectra
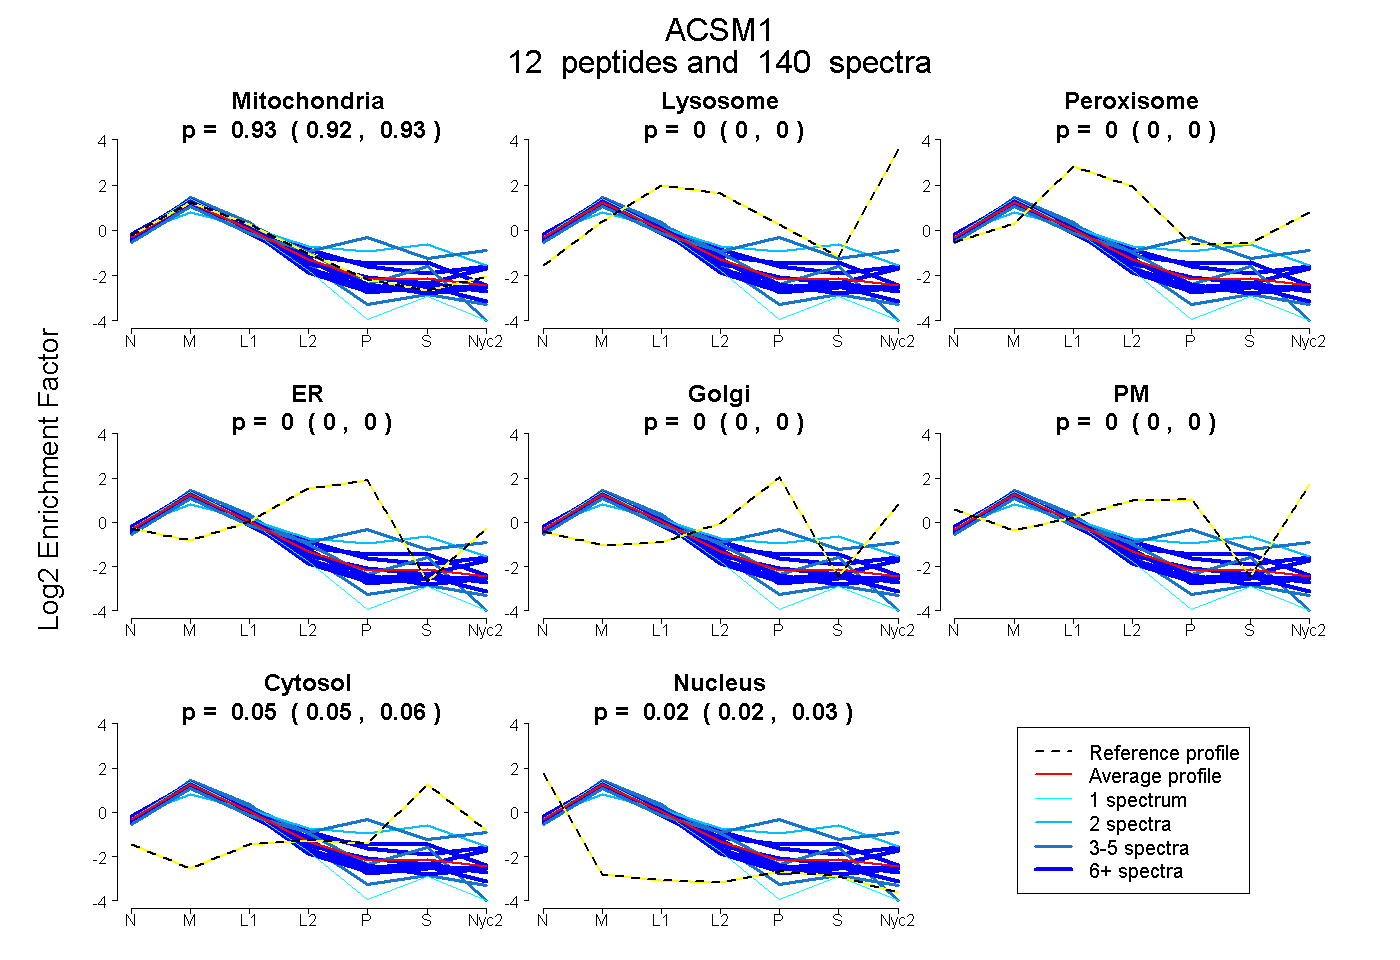
0.923 | 0.928
0.000 | 0.000
0.000 | 0.000
0.000 | 0.000
0.000 | 0.000
0.000 | 0.000
0.047 | 0.056
0.019 | 0.025
11peptides
spectra
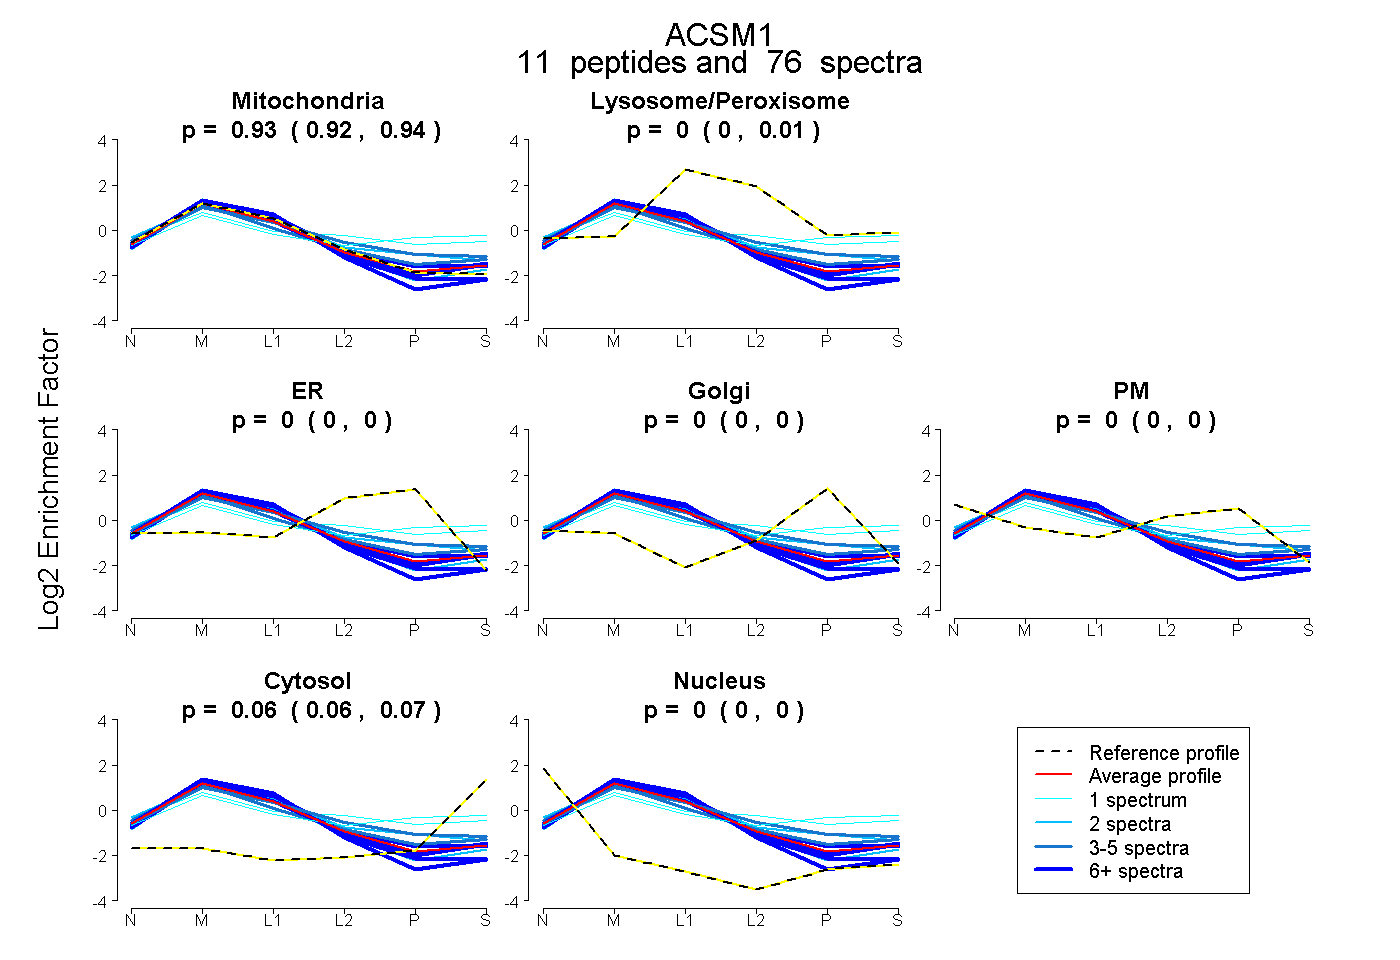
0.924 | 0.937
0.000 | 0.008
0.000 | 0.000
0.000 | 0.000
0.000 | 0.000
0.060 | 0.068
0.000 | 0.000
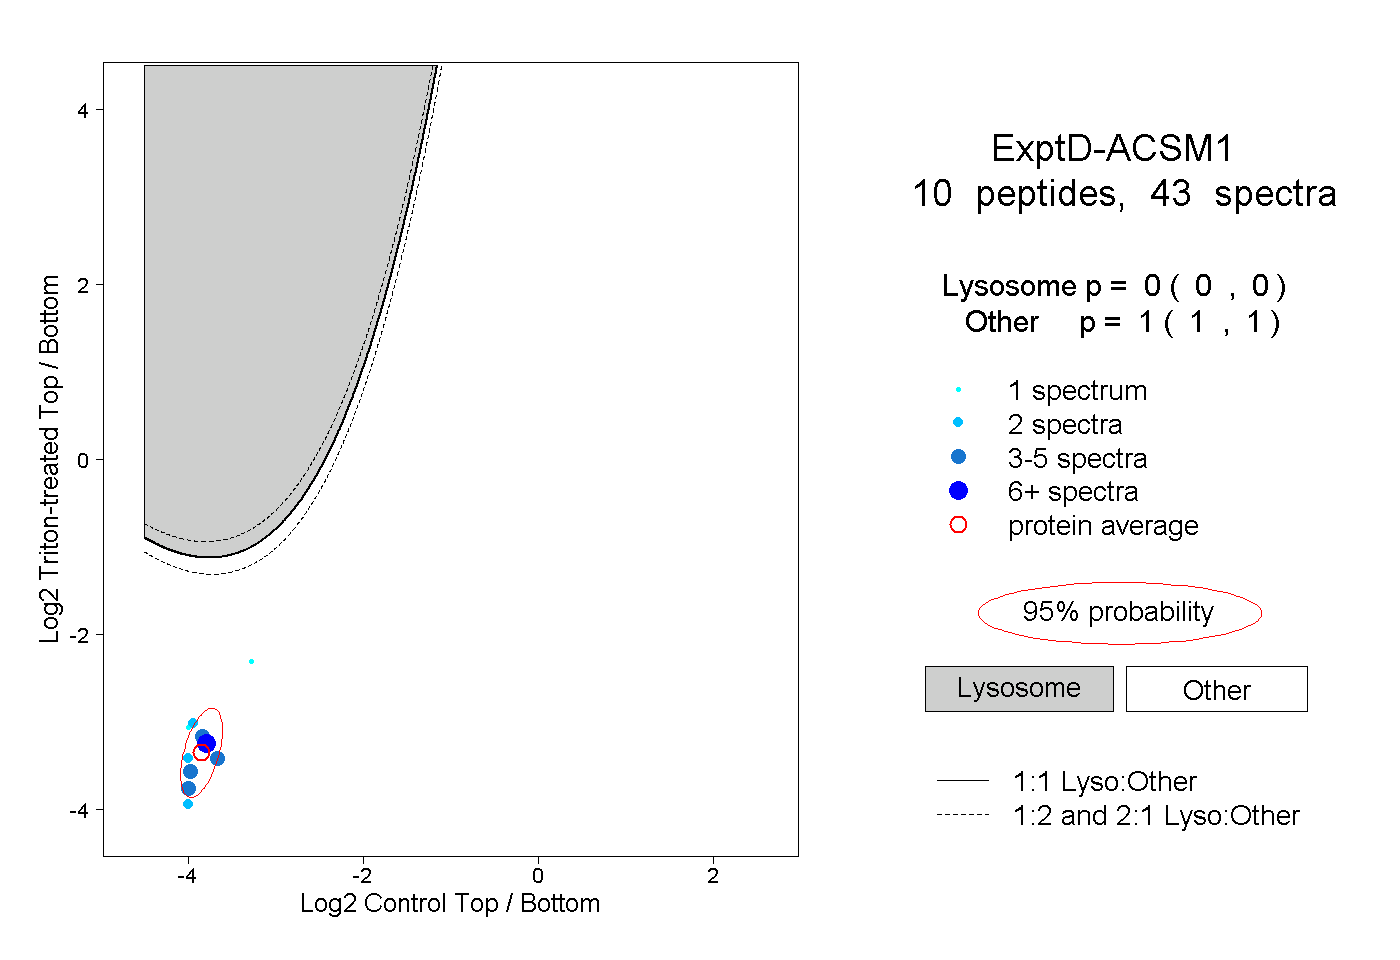
11peptides
spectra
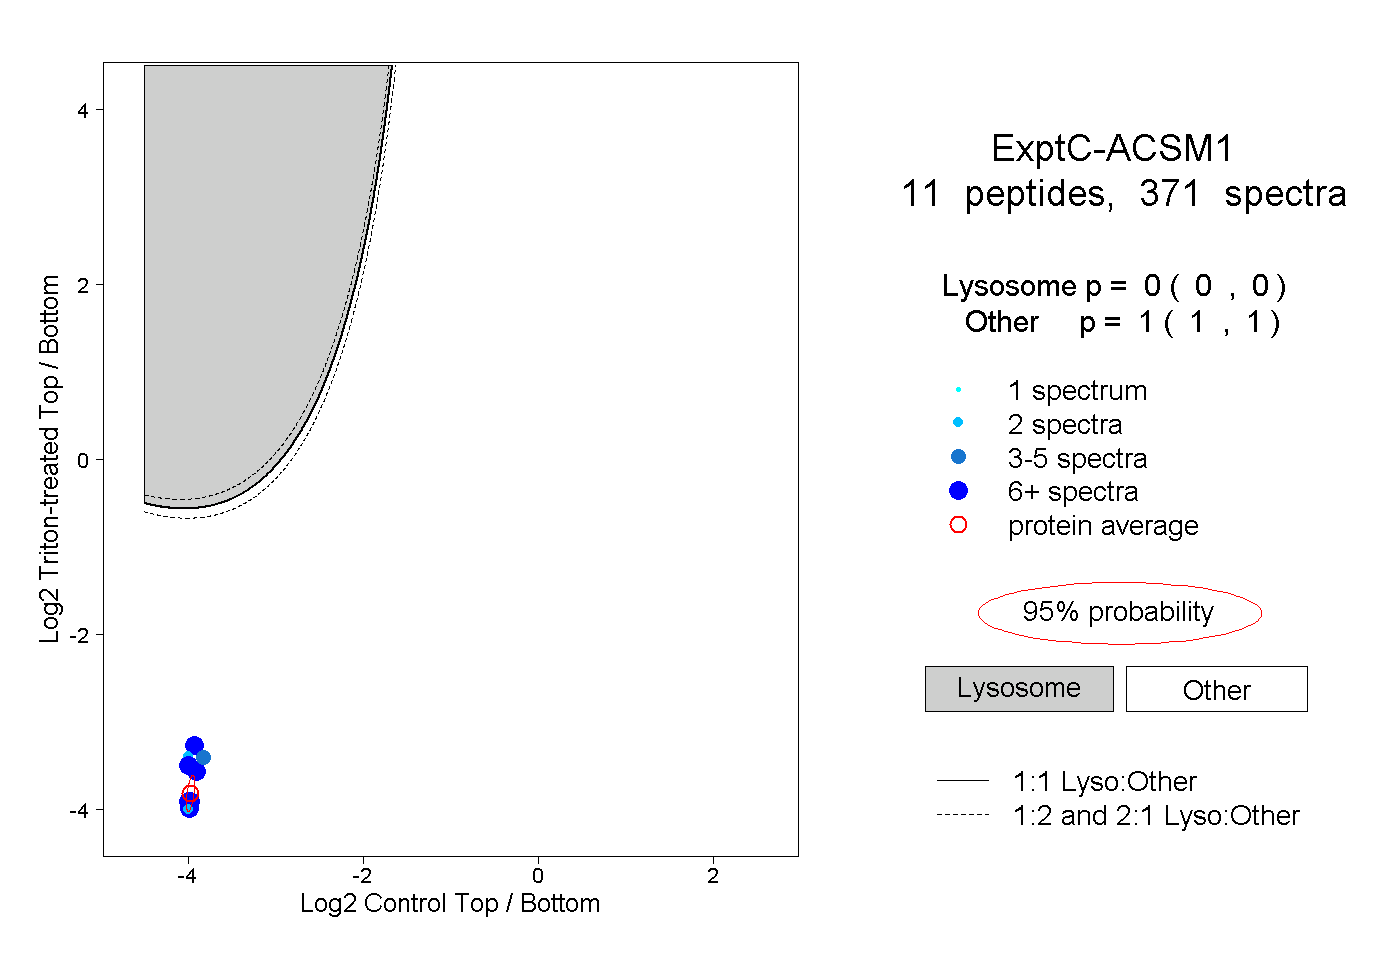
0.000 | 0.000
1.000 | 1.000