 12
12peptides
spectra
0.923 | 0.928
0.000 | 0.000
0.000 | 0.000
0.000 | 0.000
0.000 | 0.000
0.000 | 0.000
0.047 | 0.056
0.019 | 0.025
| Plot | Mito | Lyso | Perox | ER | Golgi | PM | Cytosol | Nucleus | |||||
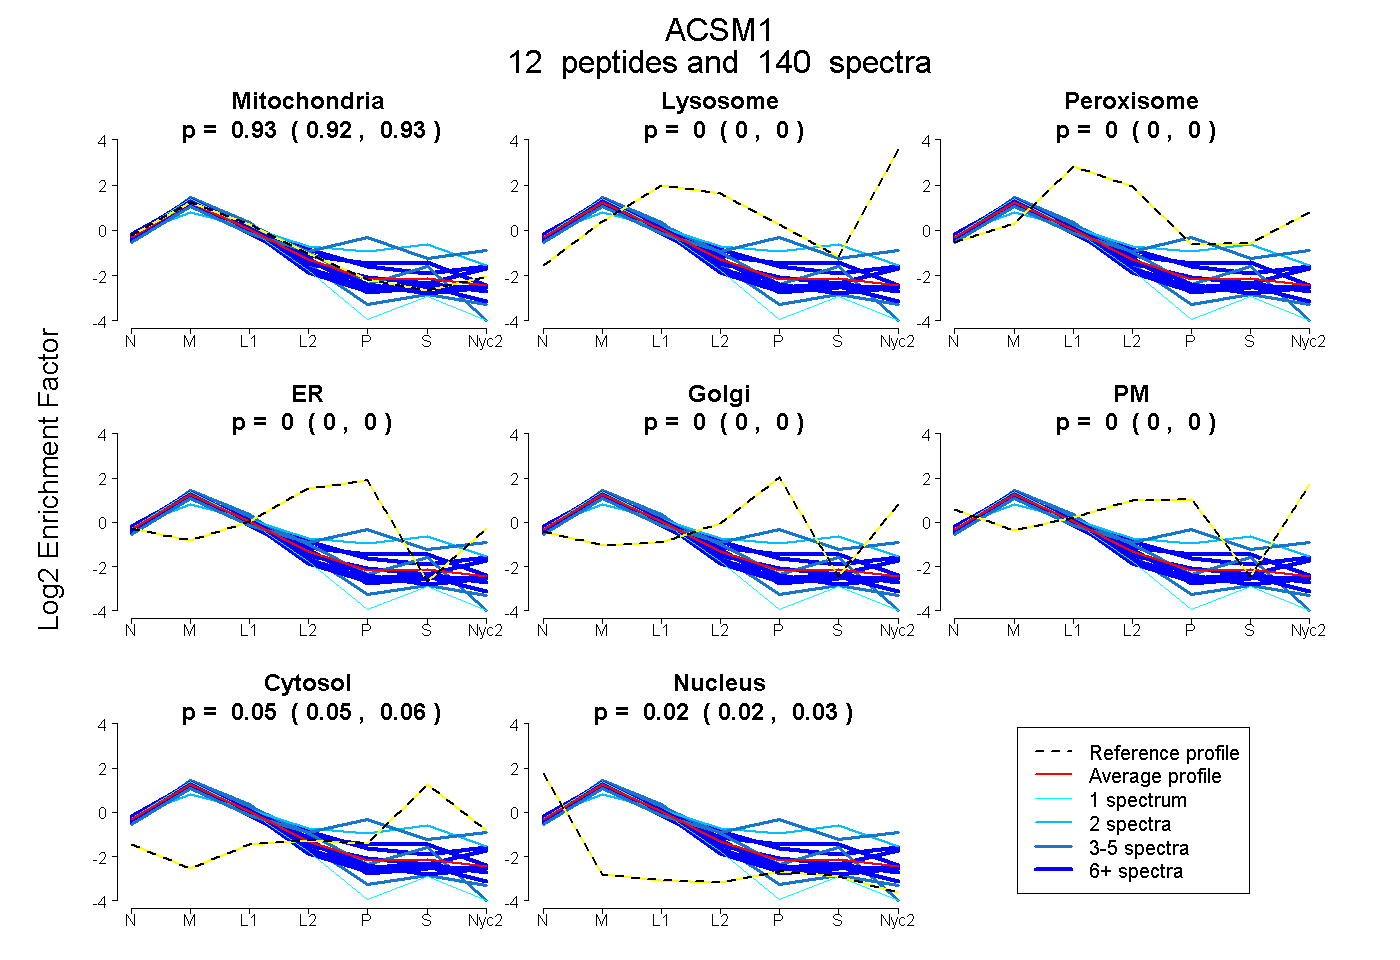
| Expt A |
12 peptides |
140 spectra |
|
0.926 0.923 | 0.928 |
0.000 0.000 | 0.000 |
0.000 0.000 | 0.000 |
0.000 0.000 | 0.000 |
0.000 0.000 | 0.000 |
0.000 0.000 | 0.000 |
0.052 0.047 | 0.056 |
0.022 0.019 | 0.025 |
| 17 spectra, VIVETLFK | 0.943 | 0.000 | 0.000 | 0.000 | 0.000 | 0.000 | 0.000 | 0.057 | ||
| 21 spectra, LALILPR | 0.917 | 0.000 | 0.000 | 0.000 | 0.000 | 0.000 | 0.000 | 0.083 | ||
| 1 spectrum, VPEWWLVTVGCIR | 0.856 | 0.000 | 0.000 | 0.000 | 0.000 | 0.000 | 0.000 | 0.144 | ||
| 21 spectra, SSVPSCR | 0.899 | 0.000 | 0.000 | 0.000 | 0.000 | 0.000 | 0.000 | 0.101 | ||
| 3 spectra, IVVSDHNHEGWLNFR | 0.922 | 0.000 | 0.000 | 0.000 | 0.000 | 0.000 | 0.031 | 0.047 | ||
| 3 spectra, GPGPALWWVNDQGDEIK | 0.946 | 0.000 | 0.000 | 0.000 | 0.000 | 0.000 | 0.000 | 0.054 | ||
| 17 spectra, TGVIFIPGTAQMK | 0.966 | 0.000 | 0.000 | 0.000 | 0.000 | 0.000 | 0.000 | 0.034 | ||
| 4 spectra, WLISGDGAQR | 0.555 | 0.077 | 0.014 | 0.000 | 0.229 | 0.000 | 0.125 | 0.000 | ||
| 12 spectra, IQMSQAK | 0.920 | 0.000 | 0.000 | 0.000 | 0.009 | 0.000 | 0.060 | 0.011 | ||
| 2 spectra, SASPDHTCVK | 0.556 | 0.000 | 0.159 | 0.013 | 0.028 | 0.000 | 0.244 | 0.000 | ||
| 14 spectra, AANVFEQTCGLQHGDR | 0.831 | 0.000 | 0.000 | 0.009 | 0.000 | 0.000 | 0.160 | 0.000 | ||
| 25 spectra, HNQGLAFR | 0.824 | 0.046 | 0.000 | 0.000 | 0.047 | 0.000 | 0.082 | 0.000 |
| Plot | Mito | Lyso or Perox | ER | Golgi | PM | Cytosol | Nucleus | ||||||
| Expt B |
11 peptides |
76 spectra |
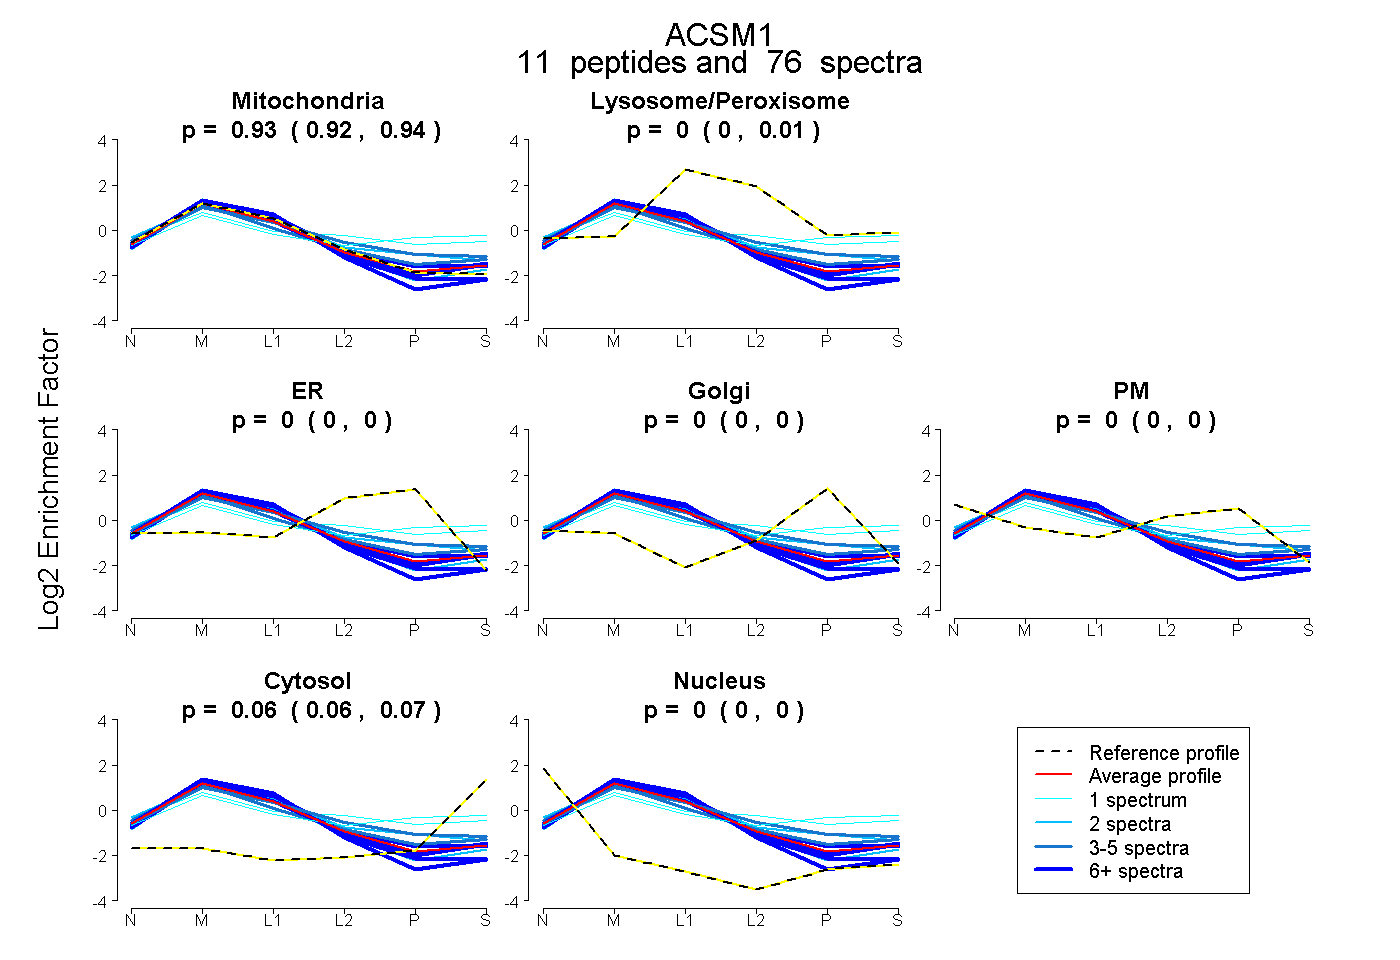 |
0.931 0.924 | 0.937 |
0.004 0.000 | 0.008 |
0.000 0.000 | 0.000 |
0.000 0.000 | 0.000 |
0.000 0.000 | 0.000 |
0.065 0.060 | 0.068 |
0.000 0.000 | 0.000 |
|||
| Plot | Lyso | Other | |||||||||||
| Expt C |
11 peptides |
371 spectra |
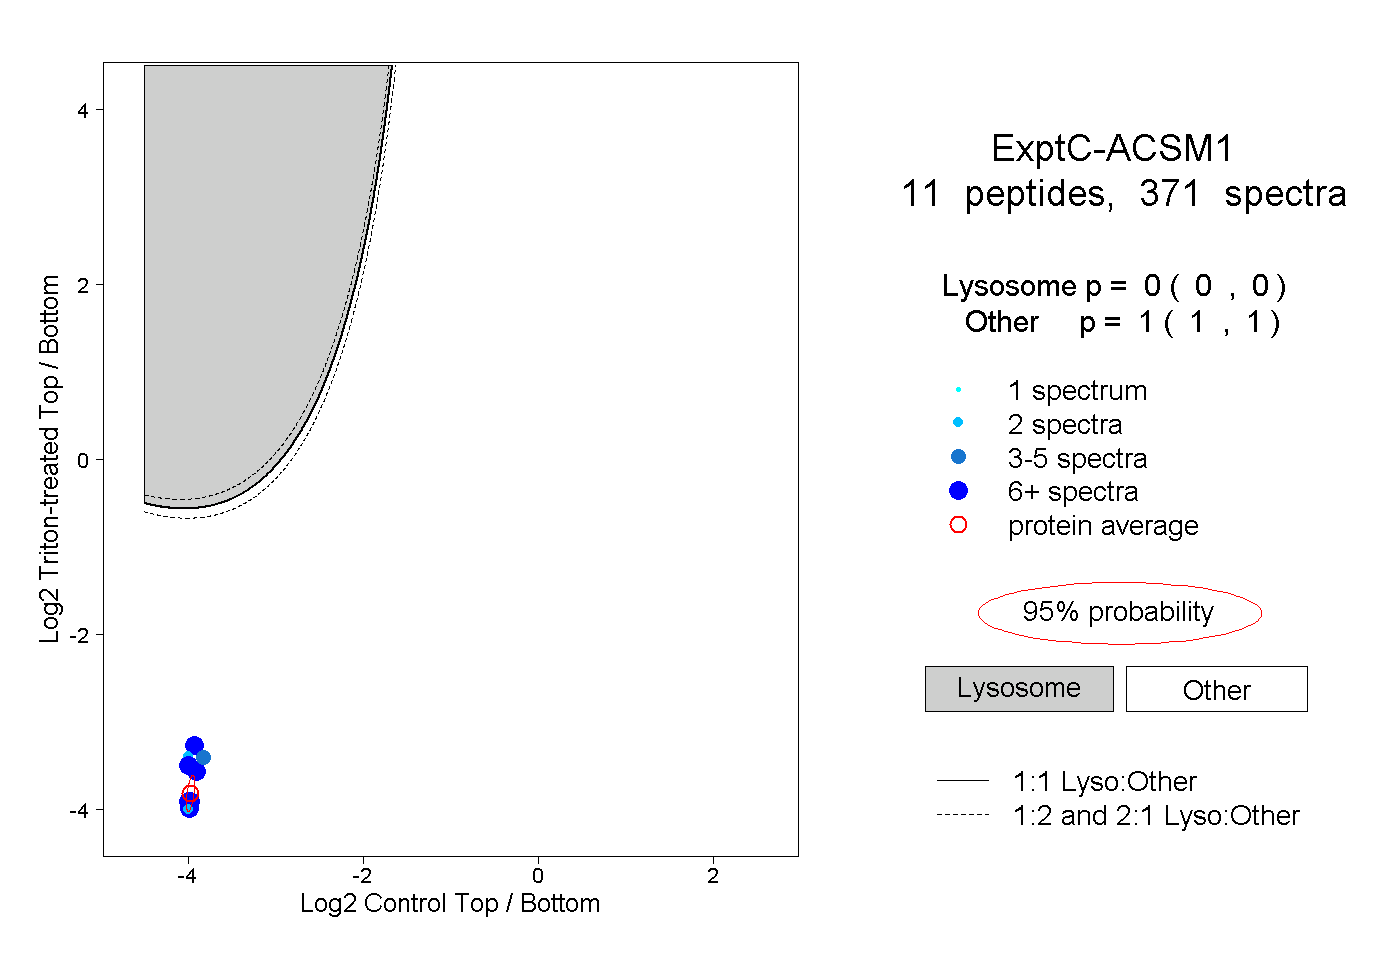 |
0.000 0.000 | 0.000 |
1.000 1.000 | 1.000 |
||||||||
| Plot | Lyso | Other | |||||||||||
| Expt D |
10 peptides |
43 spectra |
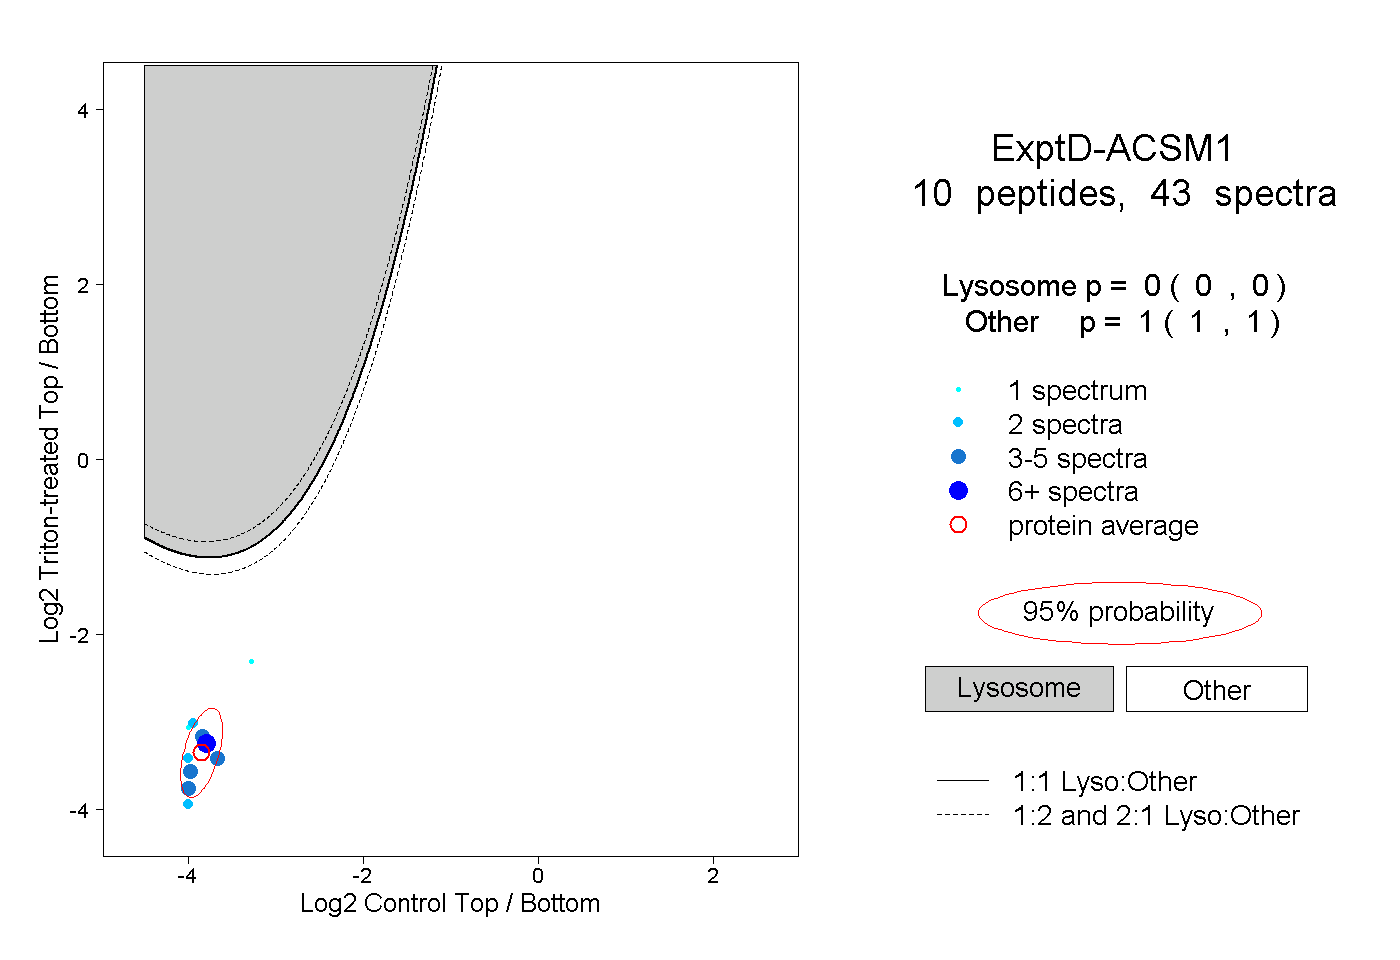 |
0.000 0.000 | 0.000 |
1.000 1.000 | 1.000 |