 9
9peptides
spectra
0.000 | 0.000
0.989 | 1.000
0.000 | 0.008
0.000 | 0.000
0.000 | 0.000
0.000 | 0.000
0.000 | 0.000
0.000 | 0.000
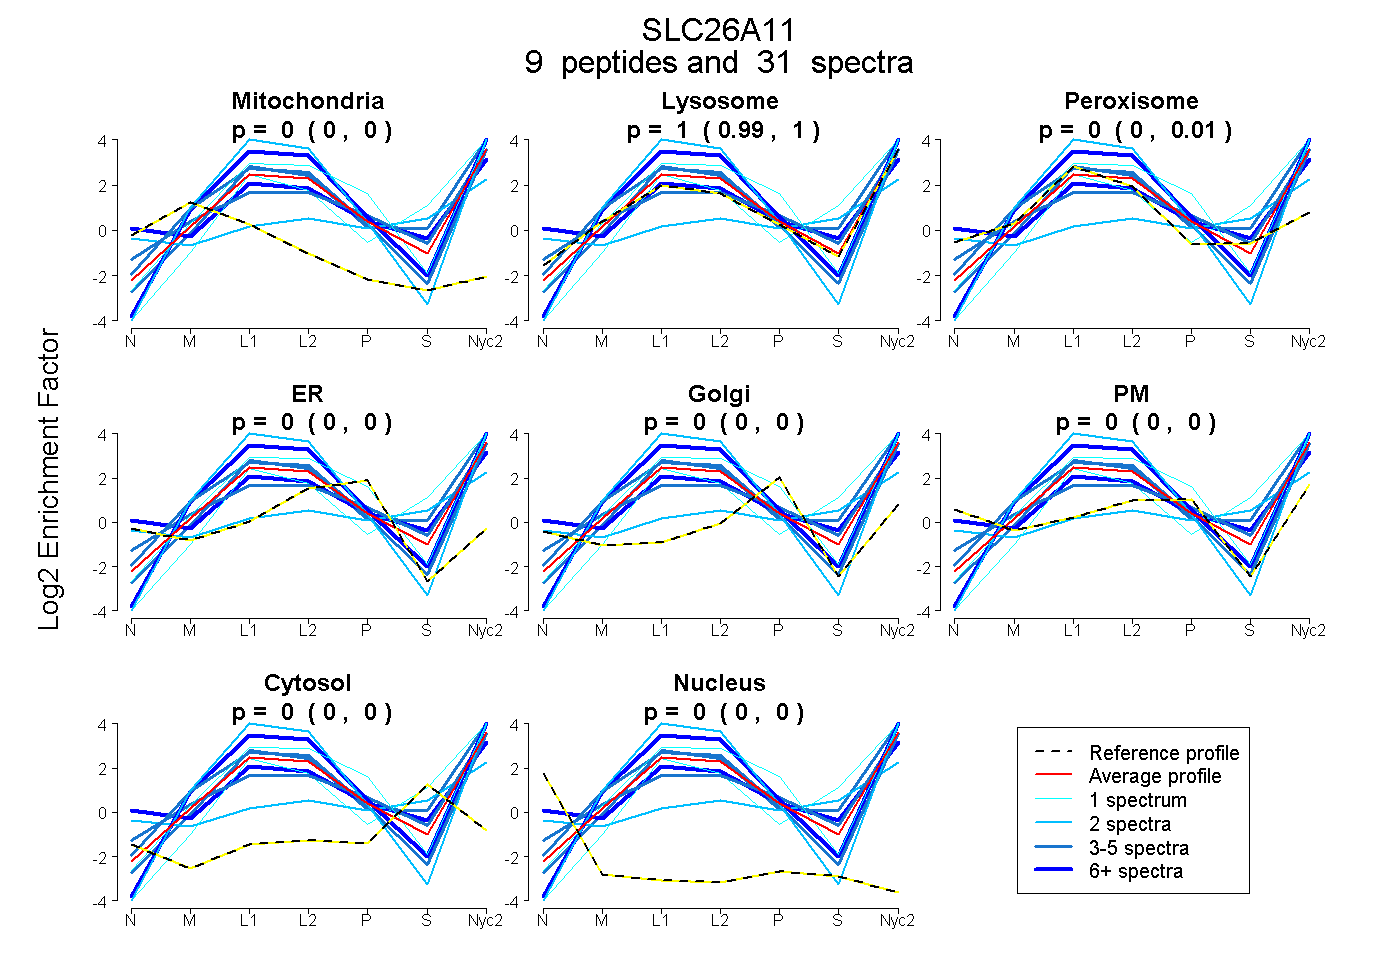
| Plot | Mito | Lyso | Perox | ER | Golgi | PM | Cytosol | Nucleus | |||||
| Expt A |
9 peptides |
31 spectra |
|
0.000 0.000 | 0.000 |
1.000 0.989 | 1.000 |
0.000 0.000 | 0.008 |
0.000 0.000 | 0.000 |
0.000 0.000 | 0.000 |
0.000 0.000 | 0.000 |
0.000 0.000 | 0.000 |
0.000 0.000 | 0.000 |
| 2 spectra, SLQQEPGTQPYSIR | 0.000 | 1.000 | 0.000 | 0.000 | 0.000 | 0.000 | 0.000 | 0.000 | ||
| 2 spectra, GFQYFTTLEEAEK | 0.000 | 0.484 | 0.000 | 0.000 | 0.000 | 0.152 | 0.364 | 0.000 | ||
| 6 spectra, APDTHCCSR | 0.000 | 0.584 | 0.244 | 0.000 | 0.000 | 0.172 | 0.000 | 0.000 | ||
| 3 spectra, ALEASPPR | 0.000 | 1.000 | 0.000 | 0.000 | 0.000 | 0.000 | 0.000 | 0.000 | ||
| 5 spectra, IAQGLPPVR | 0.000 | 0.957 | 0.000 | 0.000 | 0.024 | 0.000 | 0.019 | 0.000 | ||
| 1 spectrum, GFTSAASITIGFGQVK | 0.000 | 0.880 | 0.000 | 0.000 | 0.000 | 0.000 | 0.120 | 0.000 | ||
| 1 spectrum, TLLAADLK | 0.000 | 1.000 | 0.000 | 0.000 | 0.000 | 0.000 | 0.000 | 0.000 | ||
| 4 spectra, NLLGLQNIPR | 0.000 | 1.000 | 0.000 | 0.000 | 0.000 | 0.000 | 0.000 | 0.000 | ||
| 7 spectra, LWLVQR | 0.000 | 1.000 | 0.000 | 0.000 | 0.000 | 0.000 | 0.000 | 0.000 |
| Plot | Mito | Lyso or Perox | ER | Golgi | PM | Cytosol | Nucleus | ||||||
| Expt B |
4 peptides |
9 spectra |
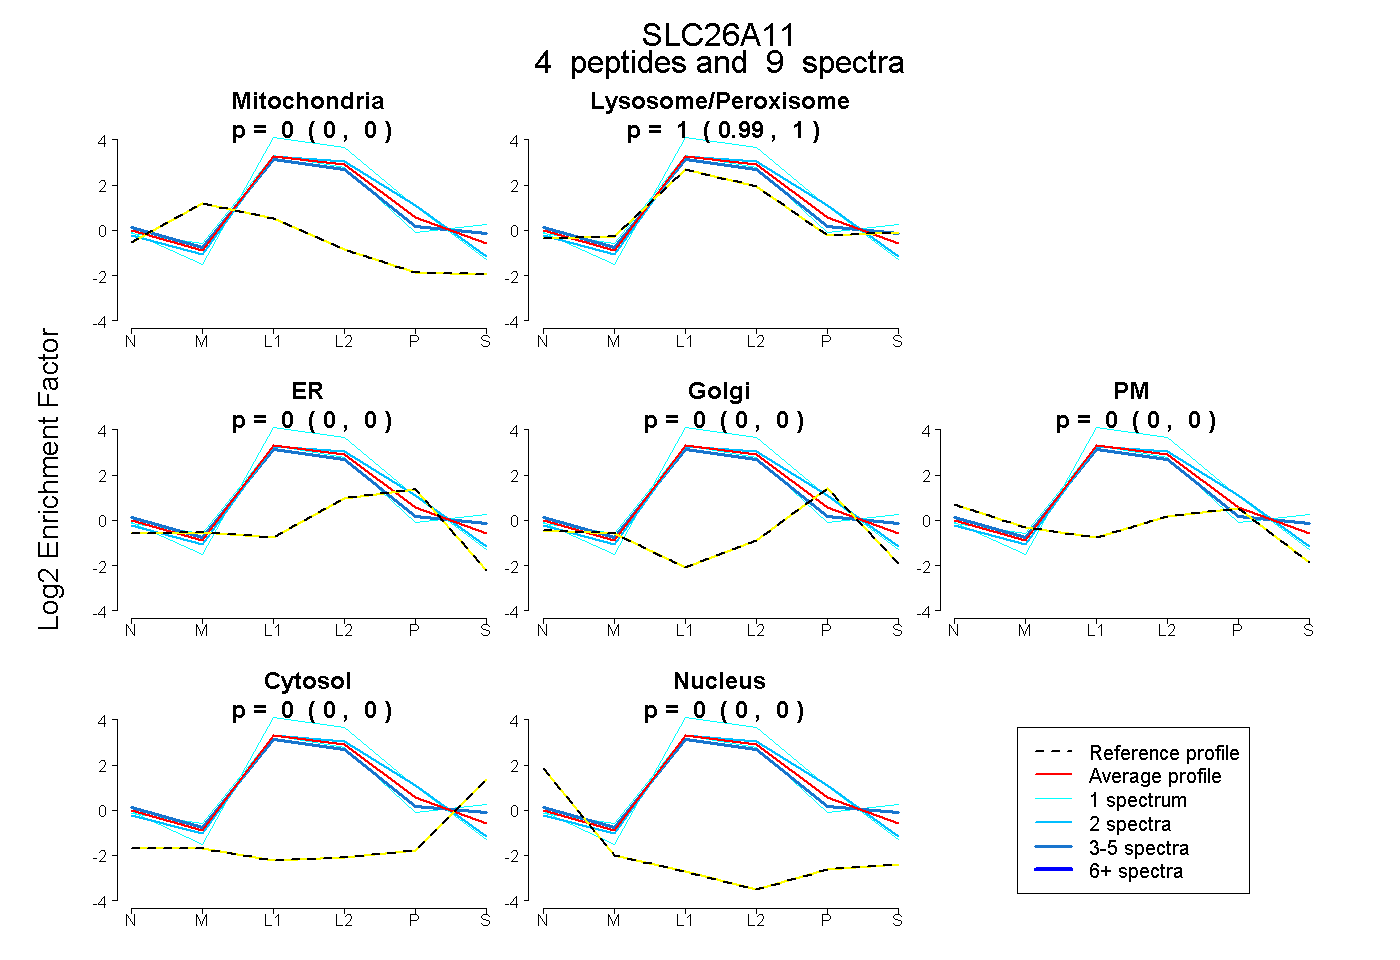 |
0.000 0.000 | 0.000 |
1.000 0.994 | 1.000 |
0.000 0.000 | 0.000 |
0.000 0.000 | 0.000 |
0.000 0.000 | 0.000 |
0.000 0.000 | 0.000 |
0.000 0.000 | 0.000 |
|||
| Plot | Lyso | Other | |||||||||||
| Expt C |
13 peptides |
102 spectra |
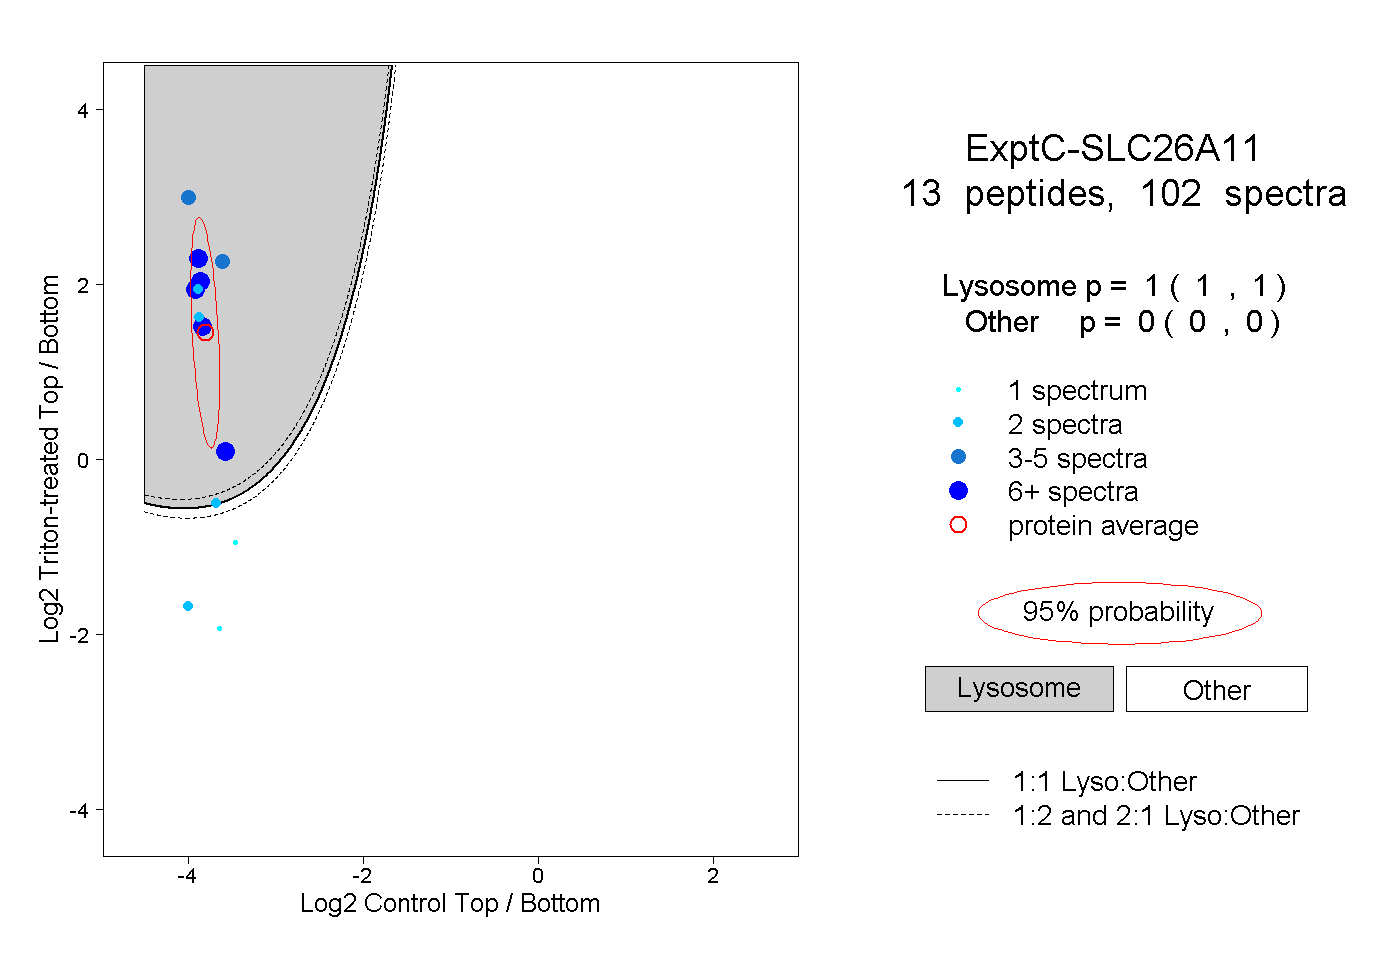 |
1.000 1.000 | 1.000 |
0.000 0.000 | 0.000 |
||||||||
| Plot | Lyso | Other | |||||||||||
| Expt D |
3 peptides |
4 spectra |
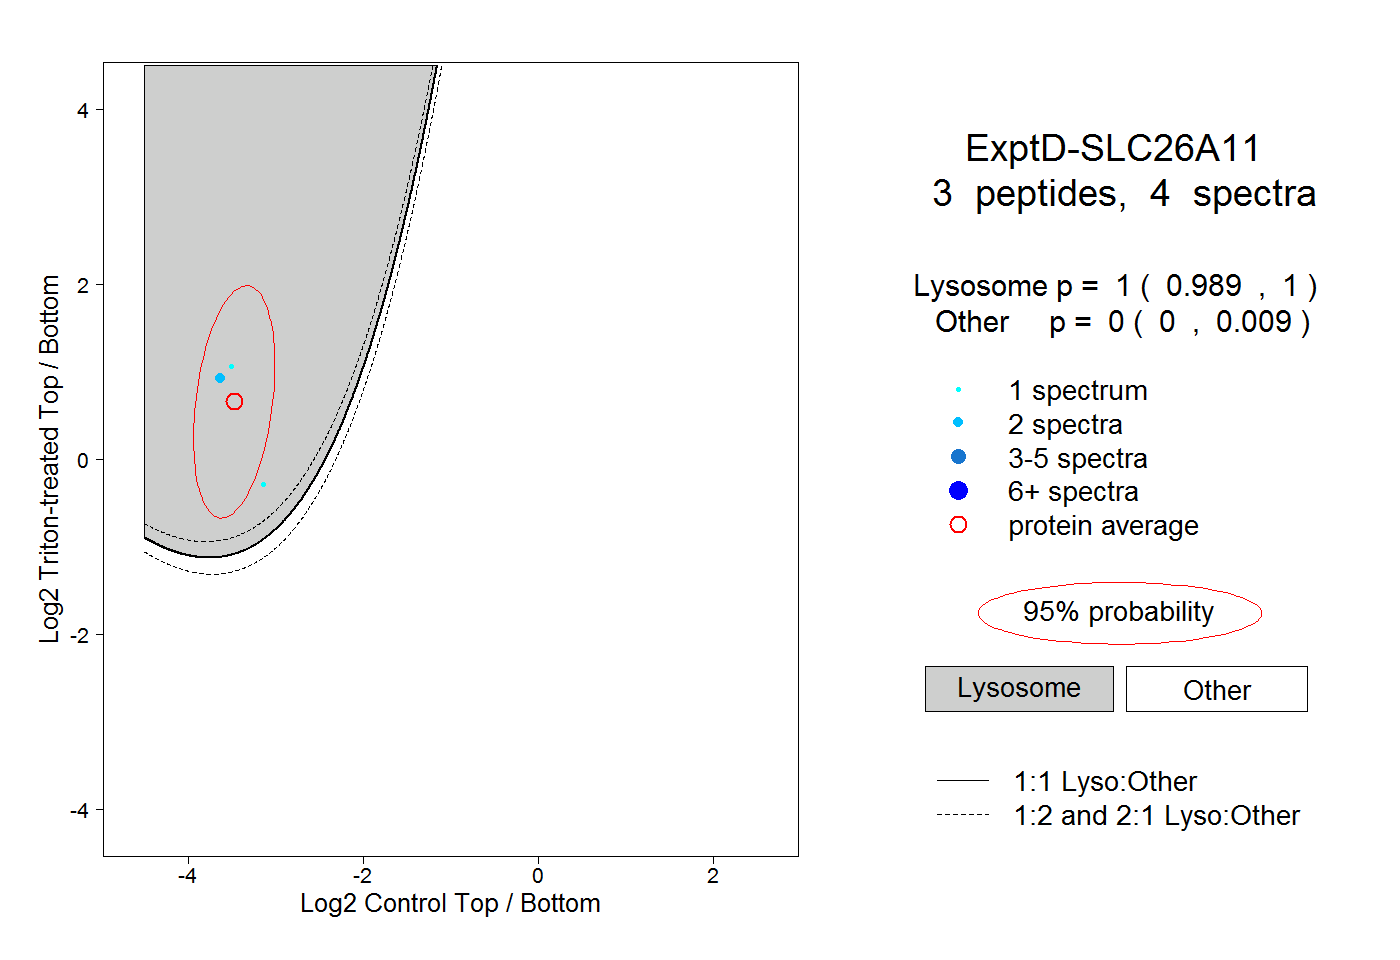 |
1.000 0.989 | 1.000 |
0.000 0.000 | 0.009 |