 4
4peptides
spectra
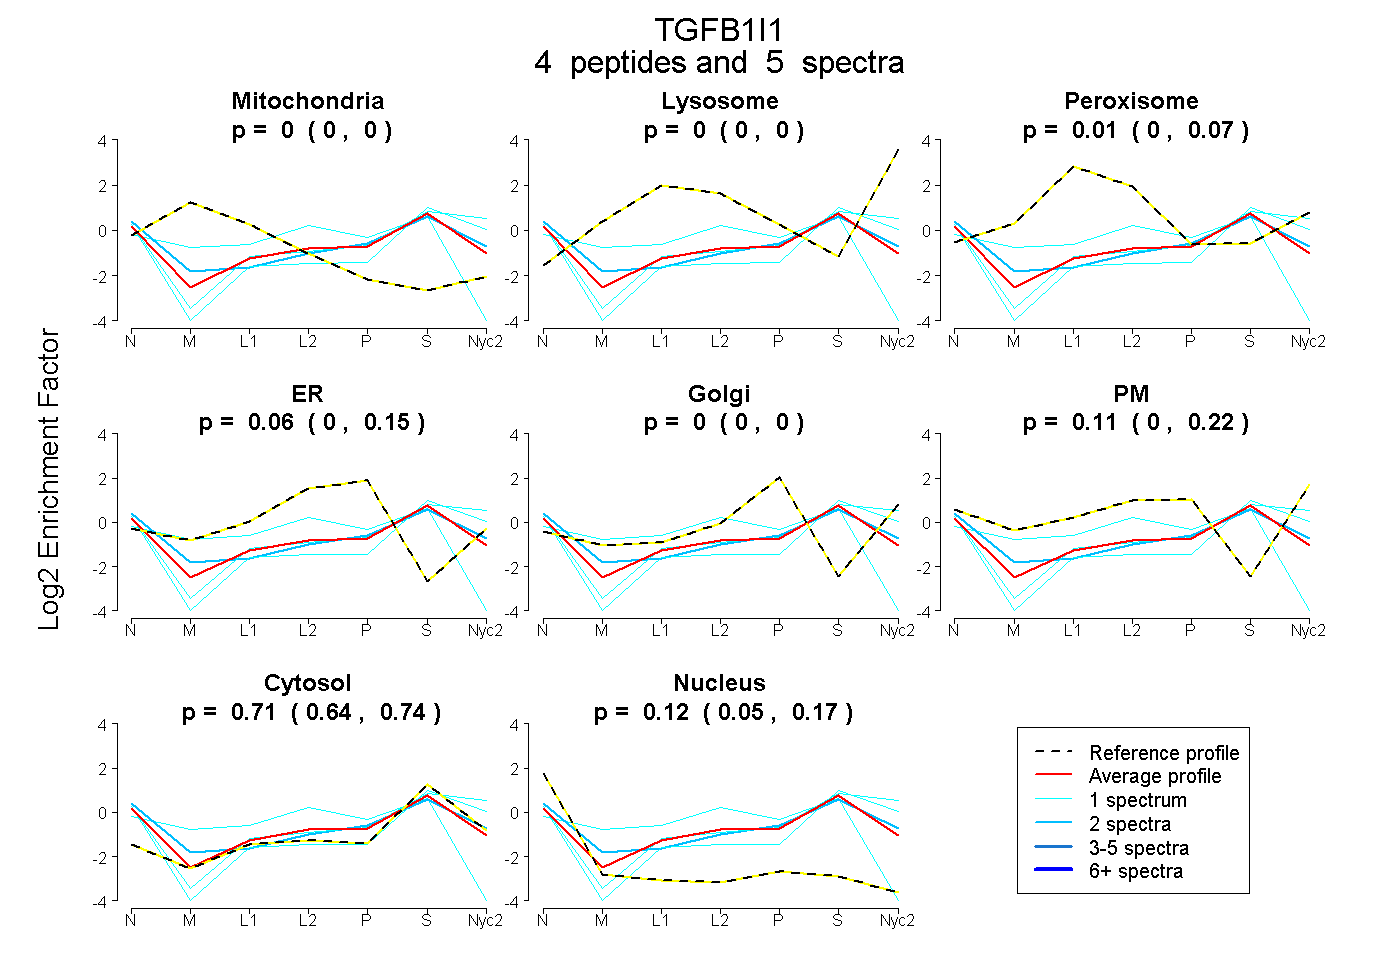
0.000 | 0.000
0.000 | 0.000
0.000 | 0.073
0.000 | 0.154
0.000 | 0.000
0.000 | 0.224
0.643 | 0.742
0.046 | 0.175
| Plot | Mito | Lyso | Perox | ER | Golgi | PM | Cytosol | Nucleus | |||||
| Expt A |
4 peptides |
5 spectra |
|
0.000 0.000 | 0.000 |
0.000 0.000 | 0.000 |
0.007 0.000 | 0.073 |
0.061 0.000 | 0.154 |
0.000 0.000 | 0.000 |
0.106 0.000 | 0.224 |
0.710 0.643 | 0.742 |
0.116 0.046 | 0.175 |
| 1 spectrum, AWHPEHFLCR | 0.272 | 0.000 | 0.000 | 0.185 | 0.000 | 0.000 | 0.477 | 0.066 | ||
| 1 spectrum, VQNHLPASGPPQPPAVSPTR | 0.000 | 0.000 | 0.000 | 0.000 | 0.000 | 0.049 | 0.838 | 0.113 | ||
| 2 spectra, DFLQLFAPR | 0.000 | 0.000 | 0.000 | 0.000 | 0.000 | 0.225 | 0.638 | 0.138 | ||
| 1 spectrum, LMASLSDFR | 0.000 | 0.000 | 0.000 | 0.000 | 0.000 | 0.220 | 0.764 | 0.016 |
| Plot | Lyso | Other | |||||||||||
| Expt C |
1 peptide |
2 spectra |
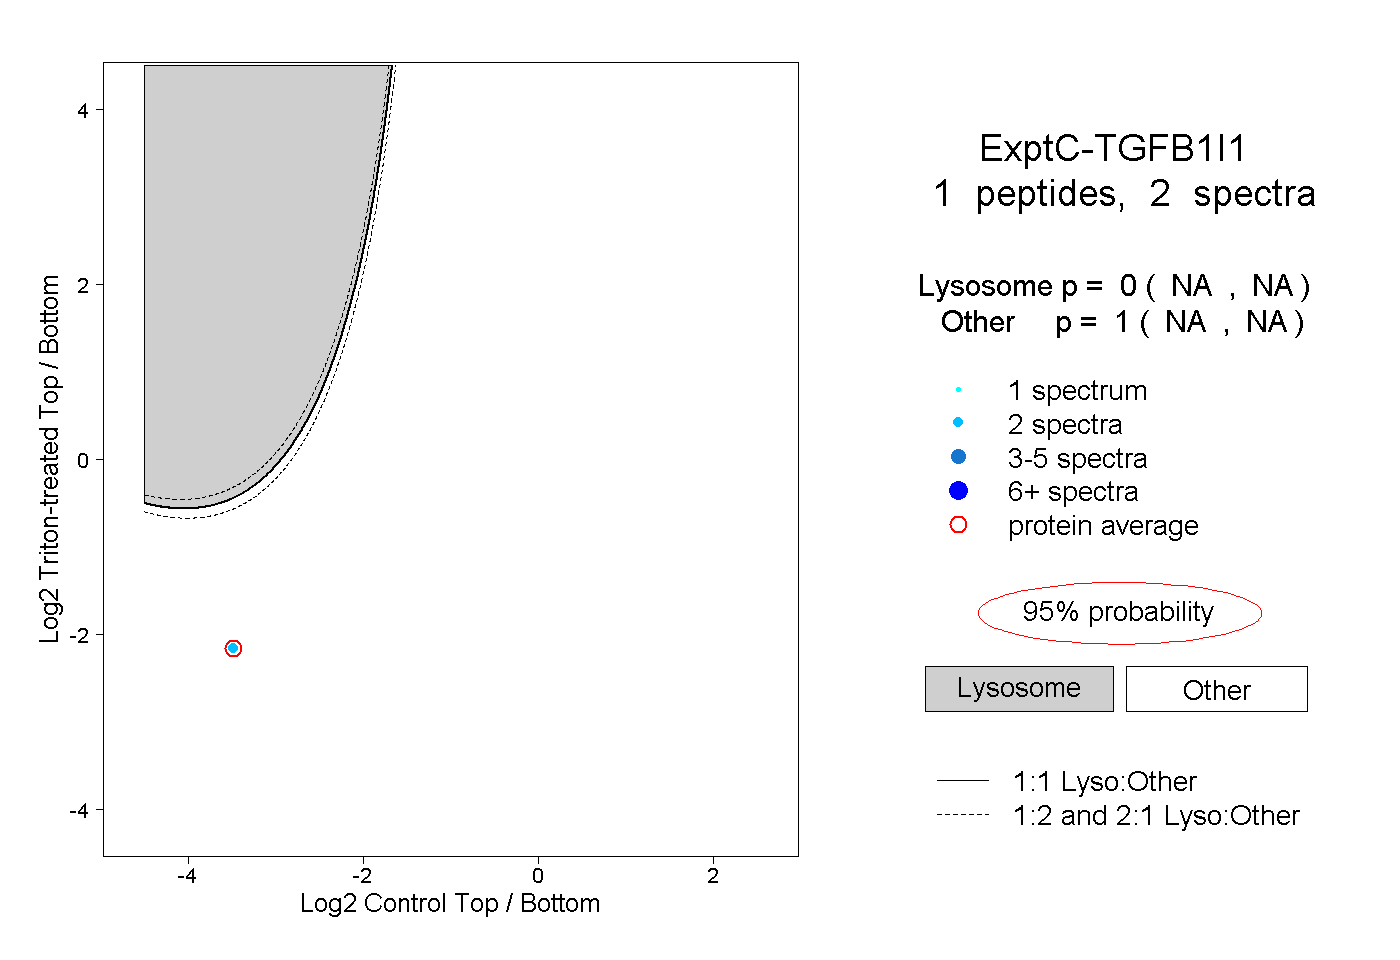 |
0.000 NA | NA |
1.000 NA | NA |