15
15peptides
spectra
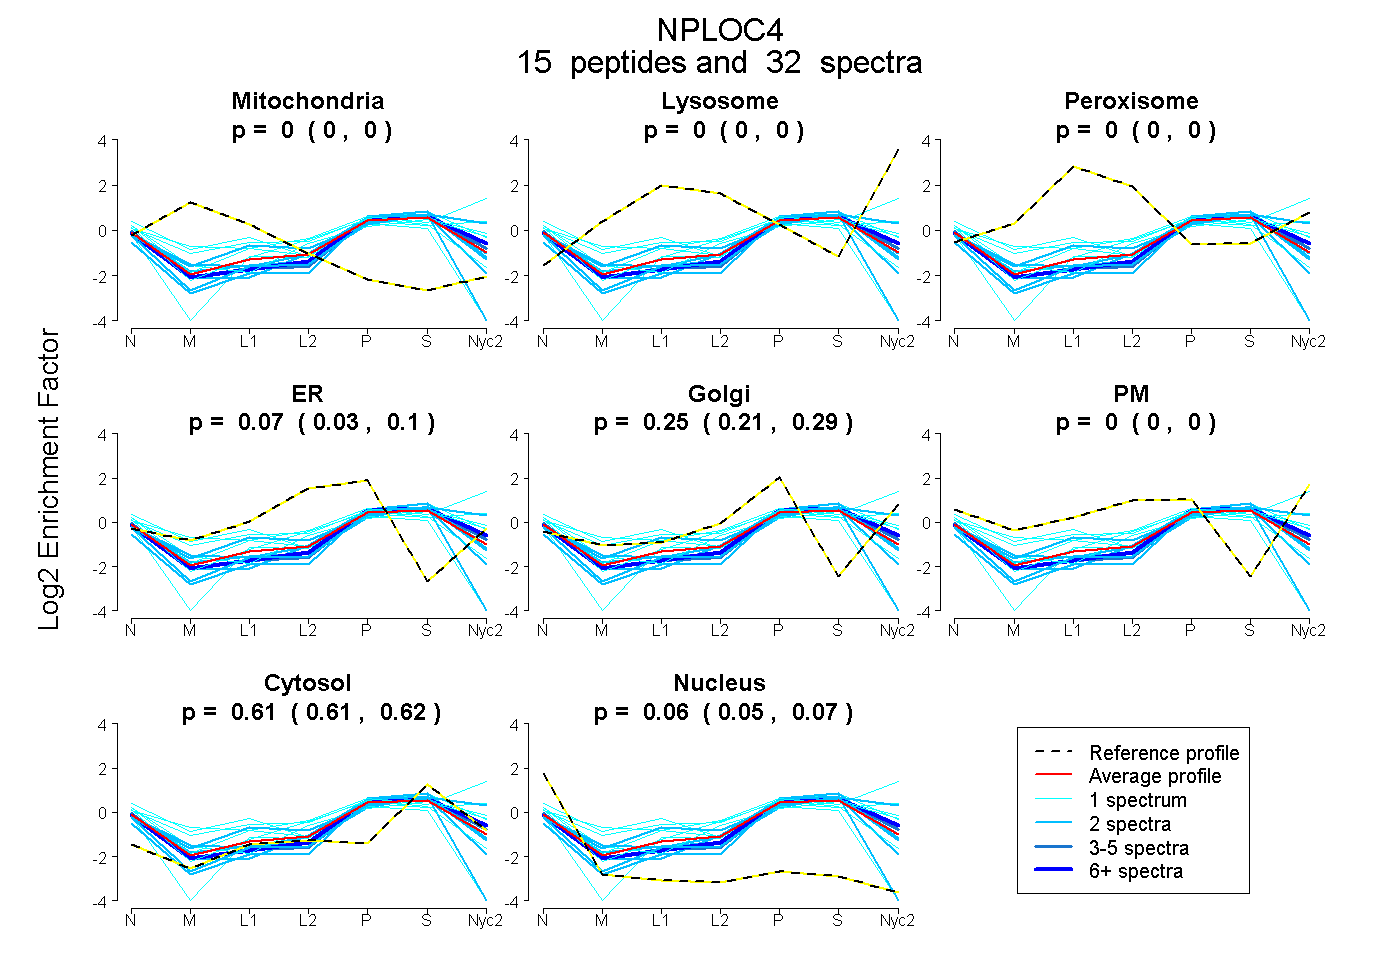
0.000 | 0.000
0.000 | 0.000
0.000 | 0.000
0.032 | 0.099
0.207 | 0.292
0.000 | 0.000
0.610 | 0.619
0.051 | 0.071
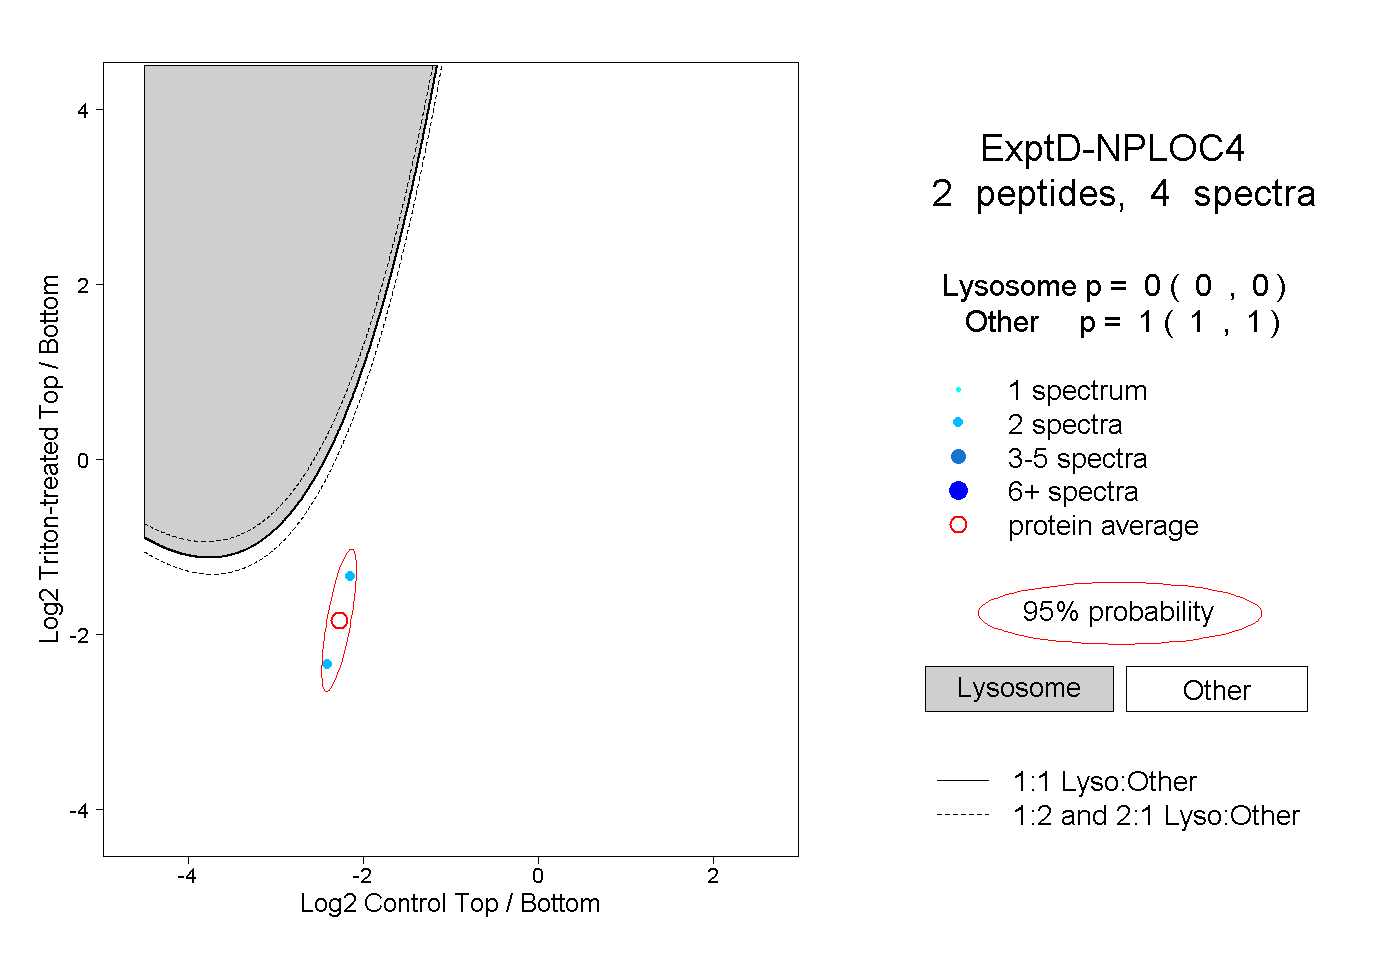
4peptides
spectra
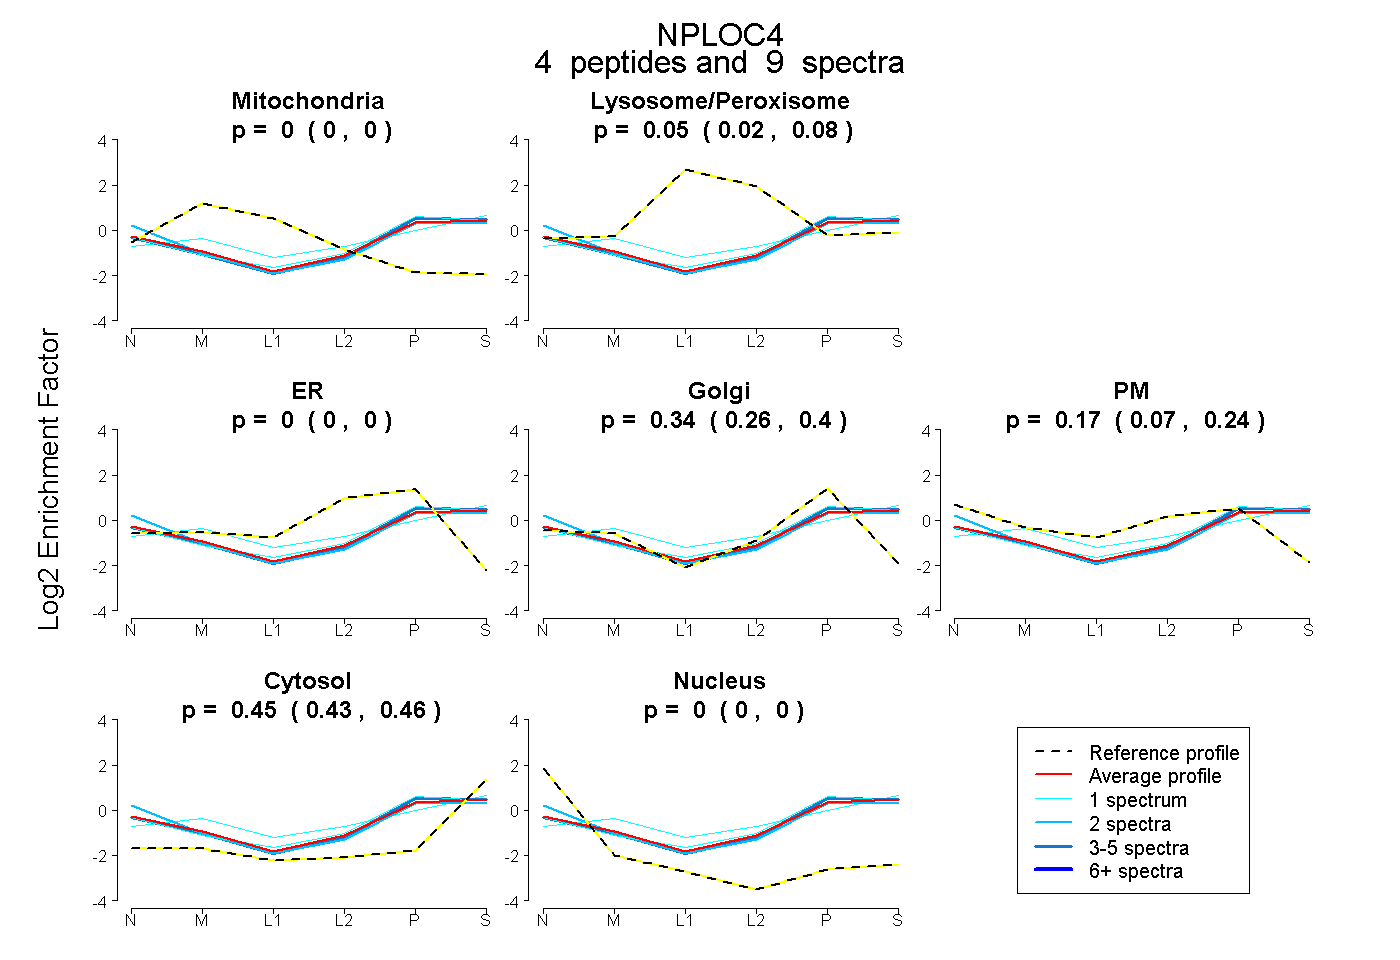
0.000 | 0.000
0.019 | 0.077
0.000 | 0.000
0.264 | 0.396
0.075 | 0.242
0.430 | 0.461
0.000 | 0.000