 15
15peptides
spectra
0.000 | 0.000
0.000 | 0.000
0.000 | 0.000
0.032 | 0.099
0.207 | 0.292
0.000 | 0.000
0.610 | 0.619
0.051 | 0.071
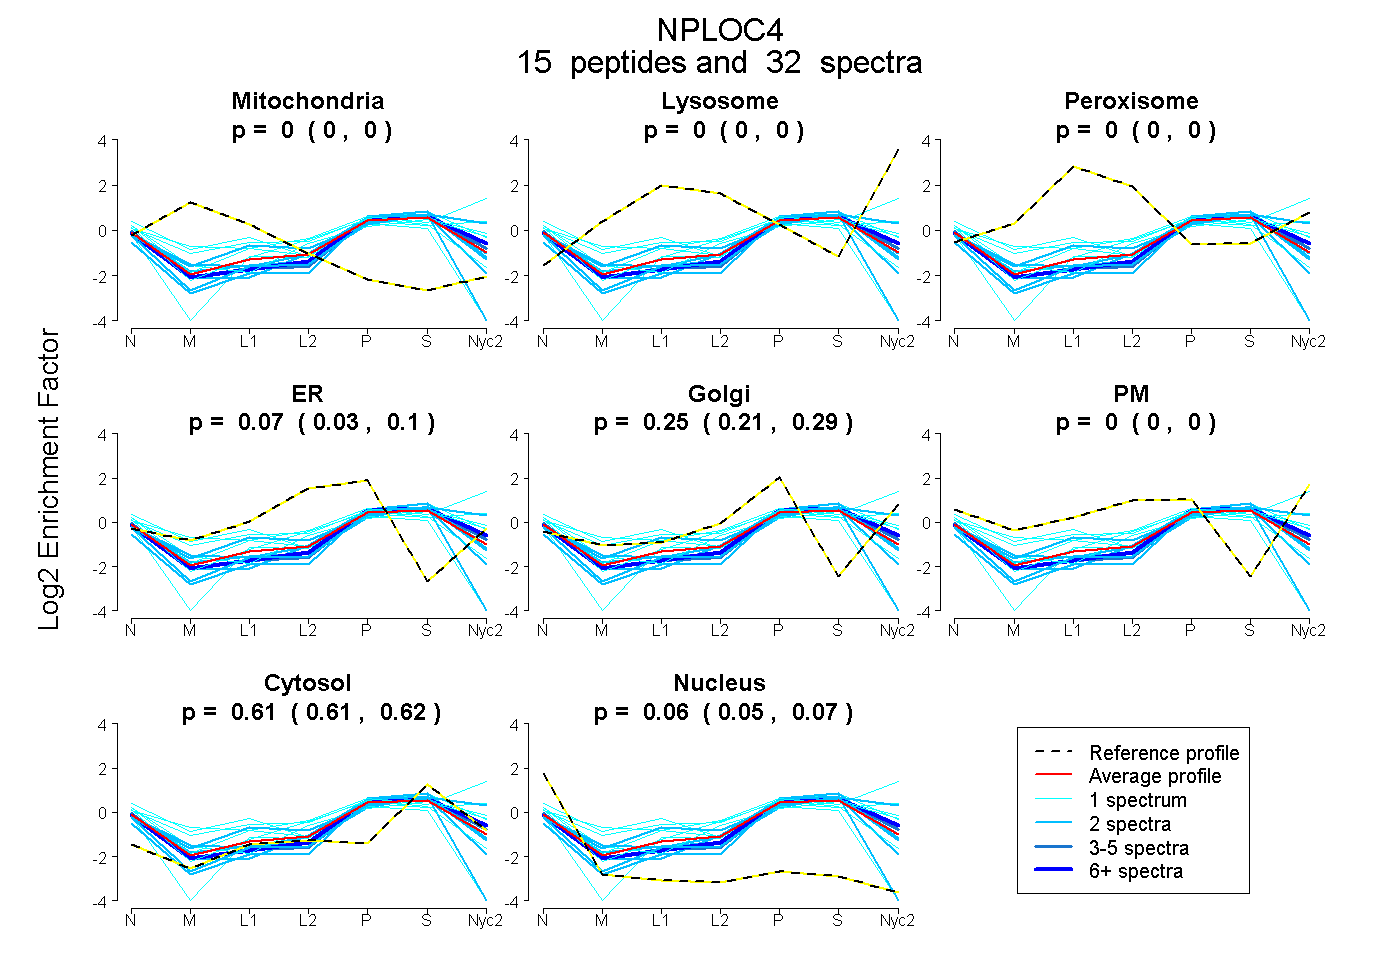
| Plot | Mito | Lyso | Perox | ER | Golgi | PM | Cytosol | Nucleus | |||||
| Expt A |
15 peptides |
32 spectra |
|
0.000 0.000 | 0.000 |
0.000 0.000 | 0.000 |
0.000 0.000 | 0.000 |
0.069 0.032 | 0.099 |
0.254 0.207 | 0.292 |
0.000 0.000 | 0.000 |
0.615 0.610 | 0.619 |
0.062 0.051 | 0.071 |
| 9 spectra, FLDFWR | 0.000 | 0.000 | 0.000 | 0.000 | 0.324 | 0.000 | 0.626 | 0.049 | ||
| 1 spectrum, AEVVDEIASK | 0.017 | 0.000 | 0.000 | 0.000 | 0.133 | 0.347 | 0.503 | 0.000 | ||
| 2 spectra, CQPSAITLNR | 0.000 | 0.000 | 0.000 | 0.143 | 0.099 | 0.000 | 0.617 | 0.141 | ||
| 1 spectrum, ESSSEQYVPDVFYK | 0.237 | 0.000 | 0.000 | 0.210 | 0.000 | 0.000 | 0.349 | 0.204 | ||
| 1 spectrum, AFGAPHVVEDEIDQYLSK | 0.000 | 0.000 | 0.000 | 0.000 | 0.245 | 0.000 | 0.755 | 0.000 | ||
| 2 spectra, VGWIFTDLVSEDTR | 0.000 | 0.000 | 0.000 | 0.000 | 0.302 | 0.000 | 0.615 | 0.083 | ||
| 2 spectra, FVALENISCK | 0.000 | 0.000 | 0.000 | 0.164 | 0.000 | 0.000 | 0.569 | 0.266 | ||
| 1 spectrum, HVDNIMFENHTVADR | 0.082 | 0.000 | 0.010 | 0.372 | 0.000 | 0.000 | 0.501 | 0.035 | ||
| 2 spectra, TGNQHFGYLYGR | 0.000 | 0.025 | 0.000 | 0.000 | 0.090 | 0.273 | 0.612 | 0.000 | ||
| 2 spectra, DECLLPCK | 0.000 | 0.000 | 0.000 | 0.014 | 0.241 | 0.000 | 0.647 | 0.098 | ||
| 1 spectrum, NEELAQTWK | 0.000 | 0.000 | 0.000 | 0.013 | 0.223 | 0.160 | 0.603 | 0.000 | ||
| 1 spectrum, HGPLGK | 0.000 | 0.000 | 0.000 | 0.000 | 0.216 | 0.151 | 0.584 | 0.049 | ||
| 4 spectra, DIPLGIR | 0.000 | 0.000 | 0.000 | 0.000 | 0.302 | 0.000 | 0.616 | 0.082 | ||
| 1 spectrum, TGEITASSSK | 0.000 | 0.035 | 0.000 | 0.000 | 0.051 | 0.434 | 0.480 | 0.000 | ||
| 2 spectra, DAPELGYAK | 0.000 | 0.000 | 0.000 | 0.000 | 0.204 | 0.000 | 0.704 | 0.091 |
| Plot | Mito | Lyso or Perox | ER | Golgi | PM | Cytosol | Nucleus | ||||||
| Expt B |
4 peptides |
9 spectra |
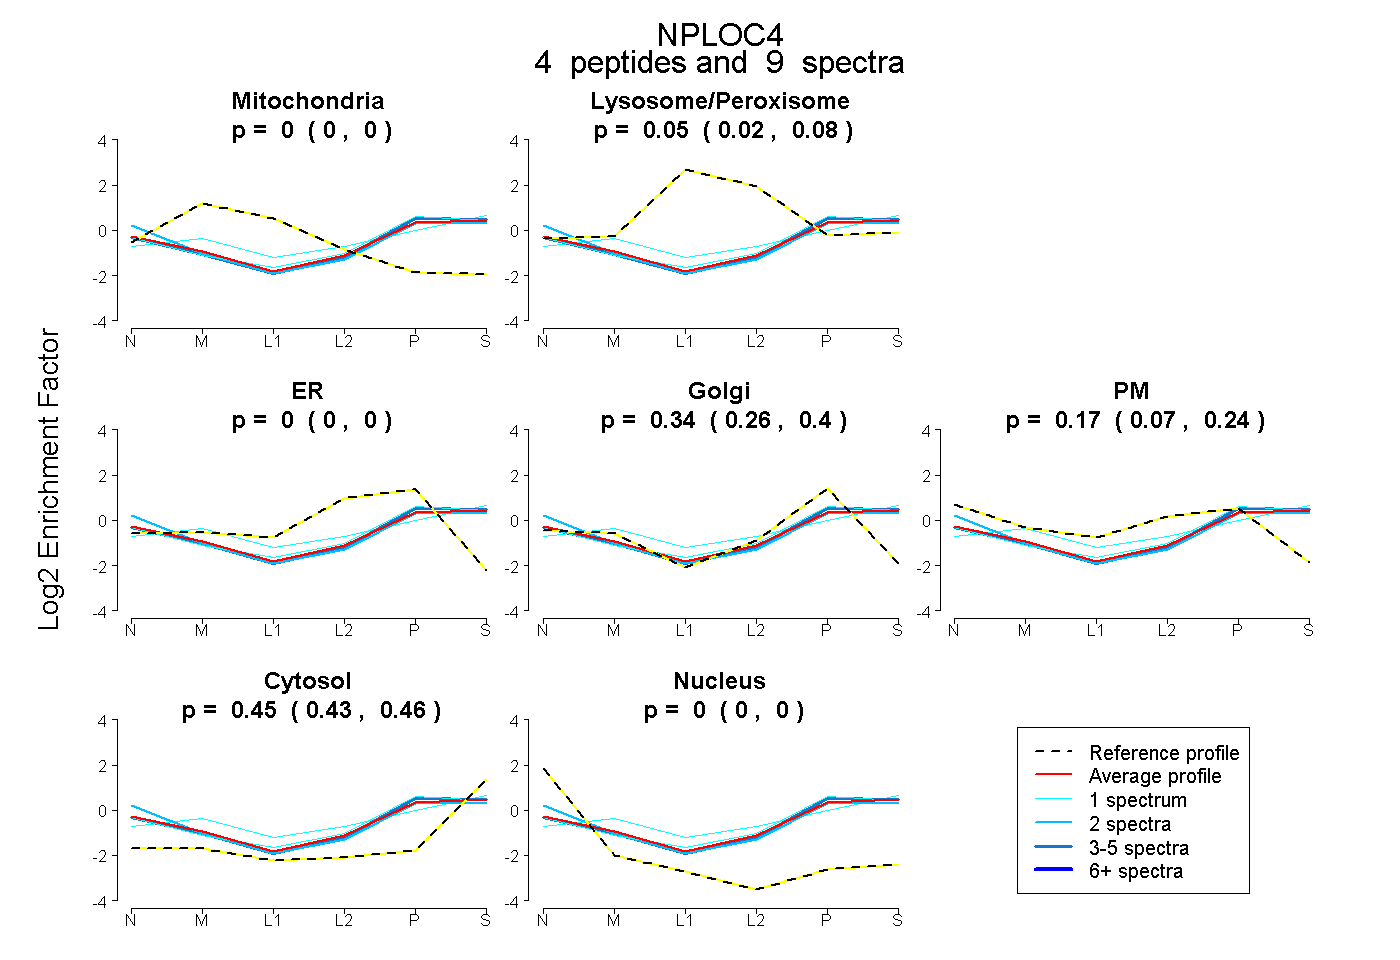 |
0.000 0.000 | 0.000 |
0.050 0.019 | 0.077 |
0.000 0.000 | 0.000 |
0.337 0.264 | 0.396 |
0.165 0.075 | 0.242 |
0.447 0.430 | 0.461 |
0.000 0.000 | 0.000 |
|||
| Plot | Lyso | Other | |||||||||||
| Expt C |
14 peptides |
30 spectra |
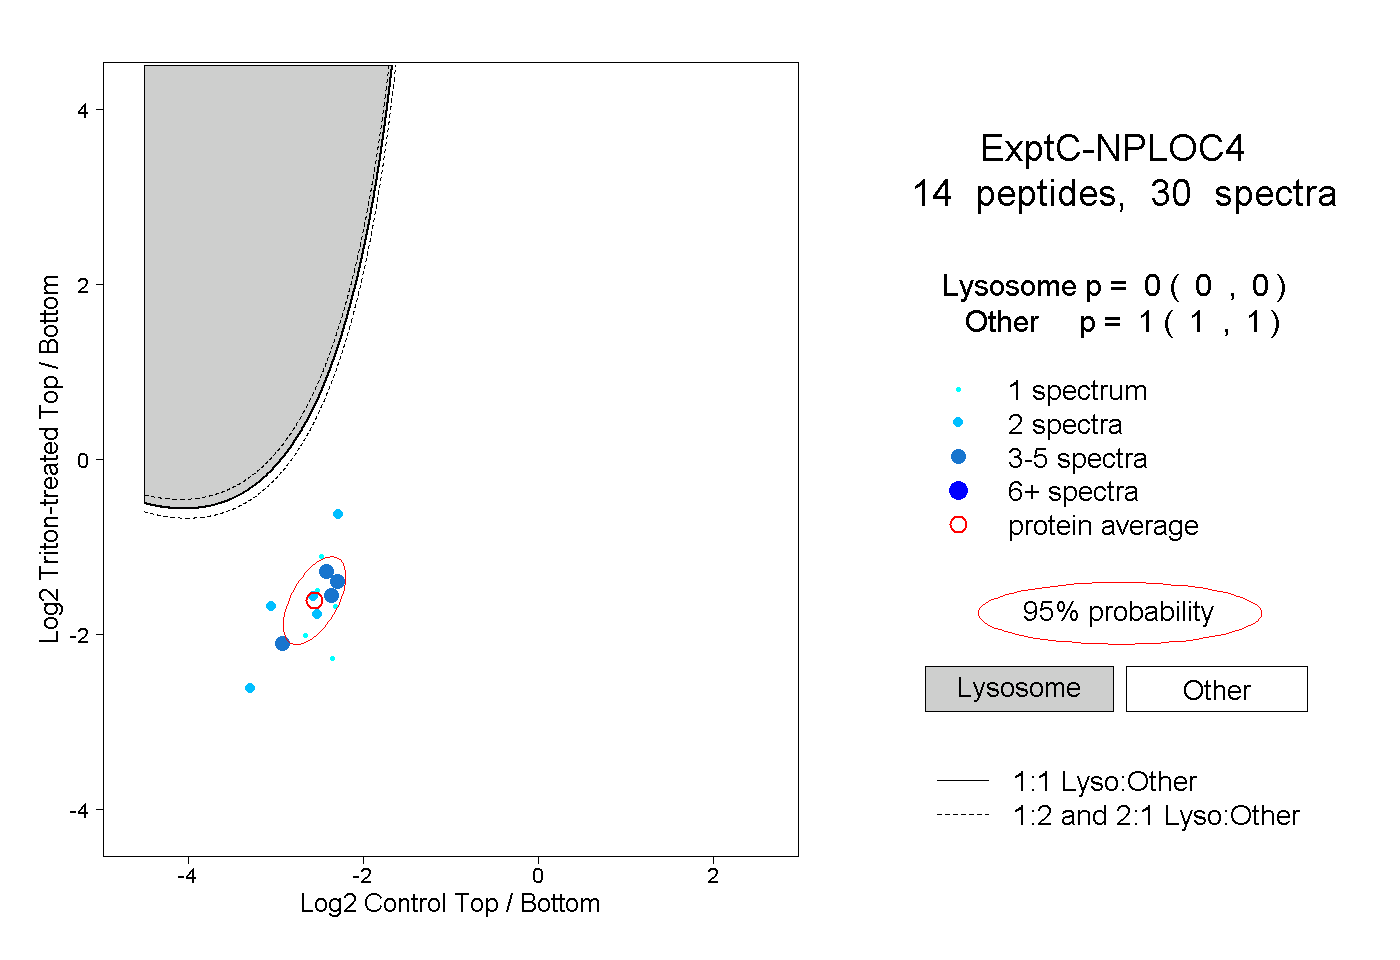 |
0.000 0.000 | 0.000 |
1.000 1.000 | 1.000 |
||||||||
| Plot | Lyso | Other | |||||||||||
| Expt D |
2 peptides |
4 spectra |
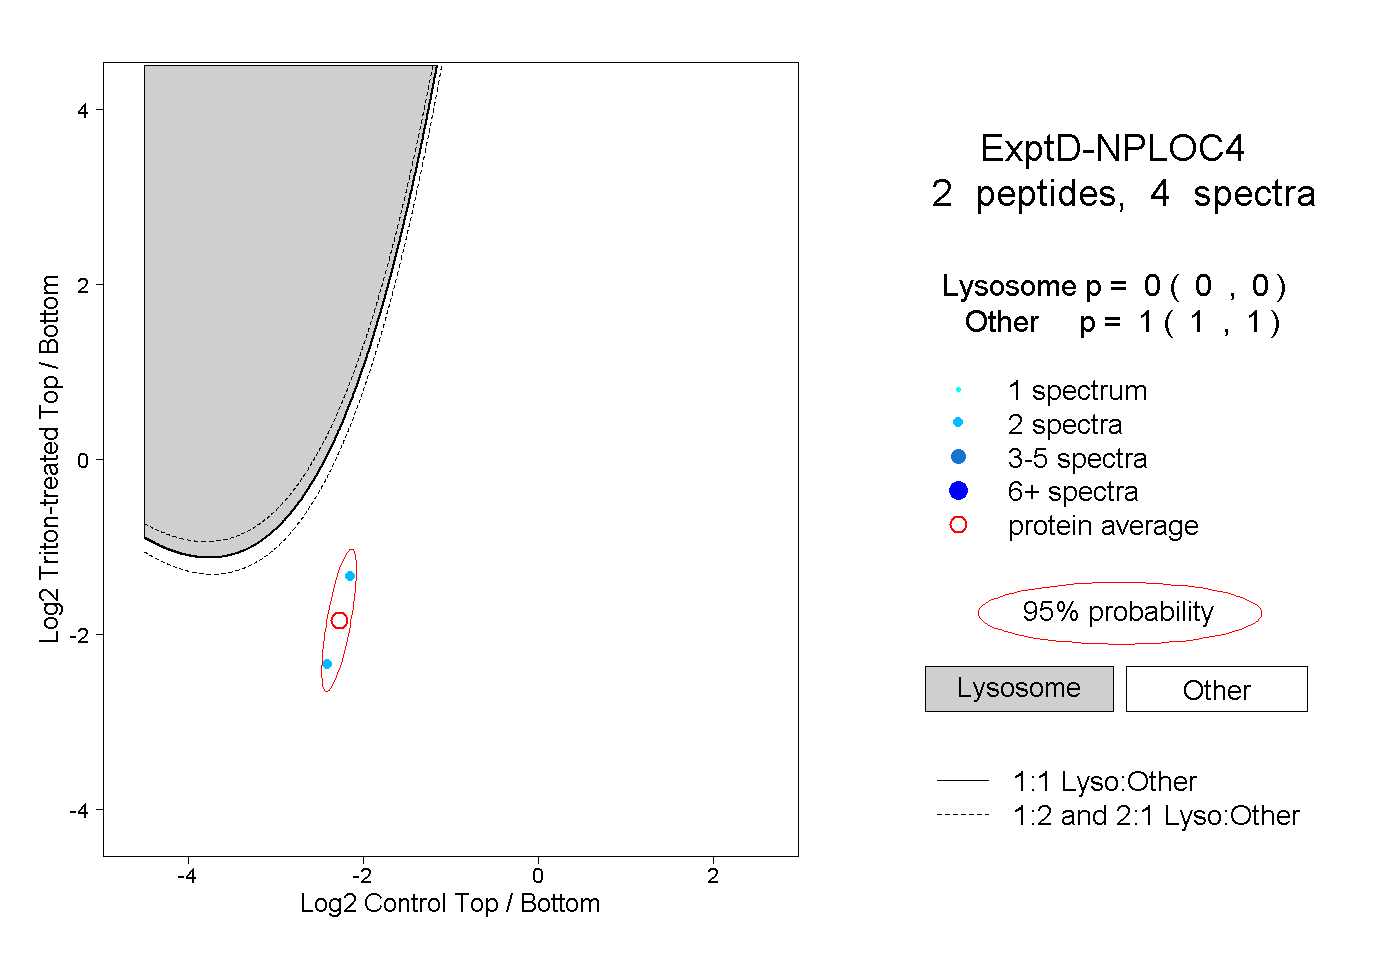 |
0.000 0.000 | 0.000 |
1.000 1.000 | 1.000 |