 12
12peptides
spectra
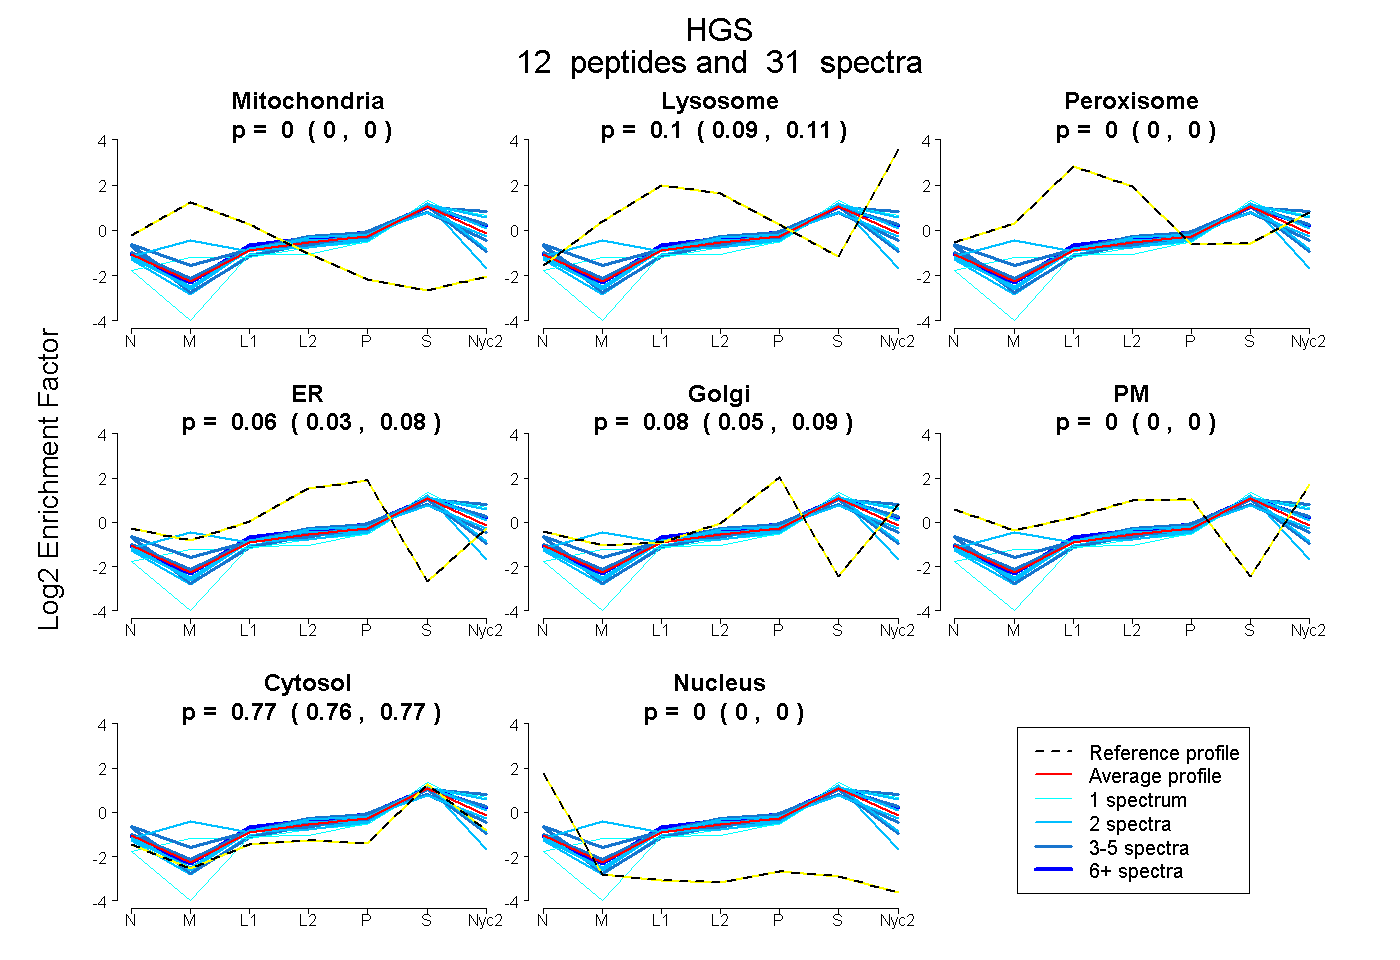
0.000 | 0.000
0.086 | 0.108
0.000 | 0.000
0.035 | 0.084
0.053 | 0.094
0.000 | 0.000
0.759 | 0.771
0.000 | 0.000
2peptides
spectra
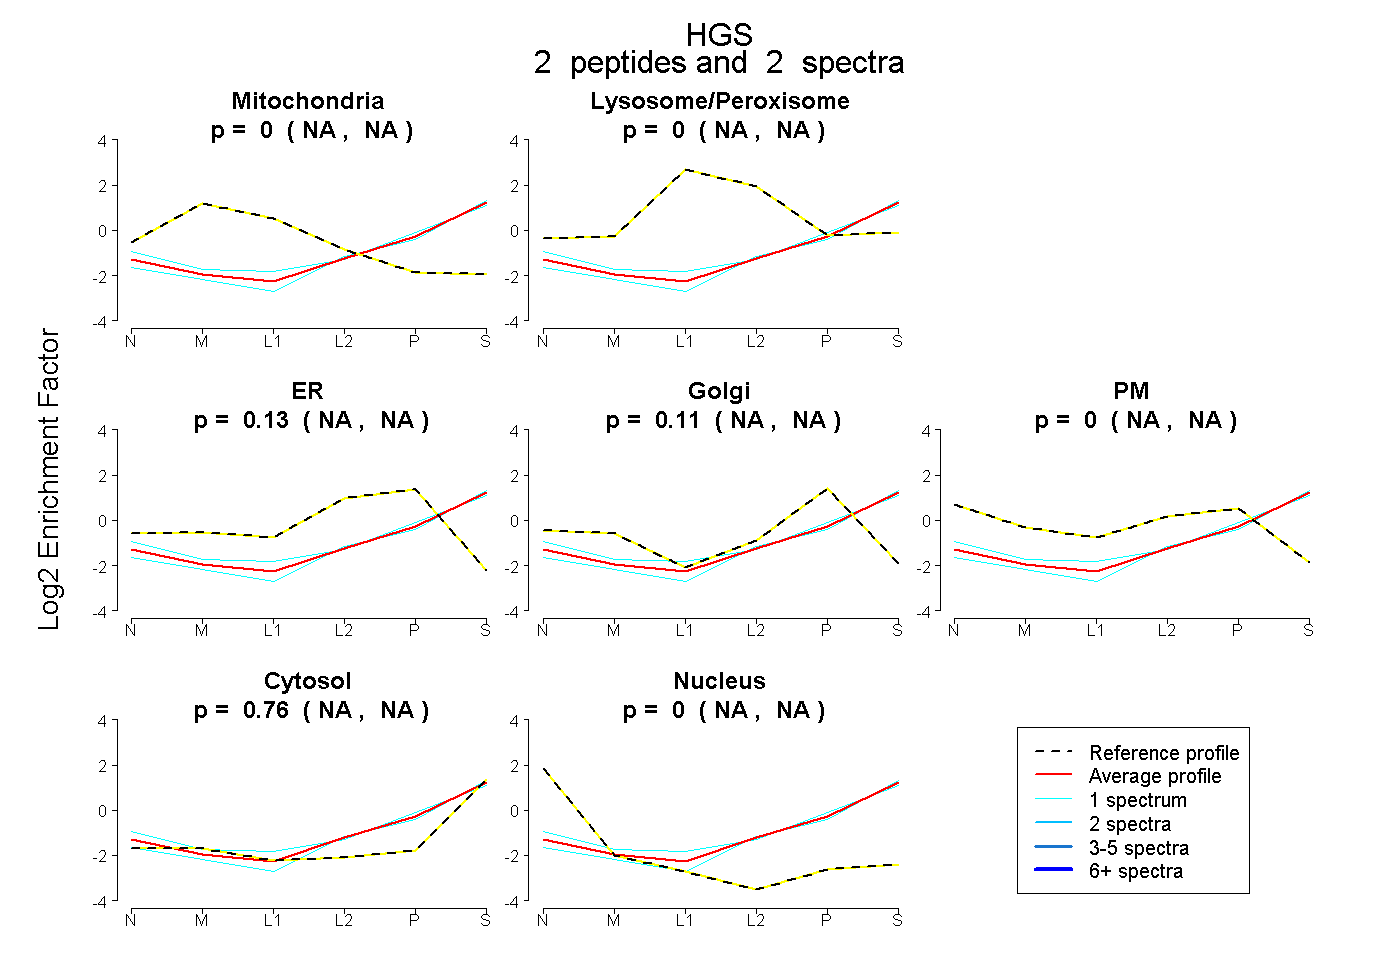
NA | NA
NA | NA
NA | NA
NA | NA
NA | NA
NA | NA
NA | NA
15peptides
spectra
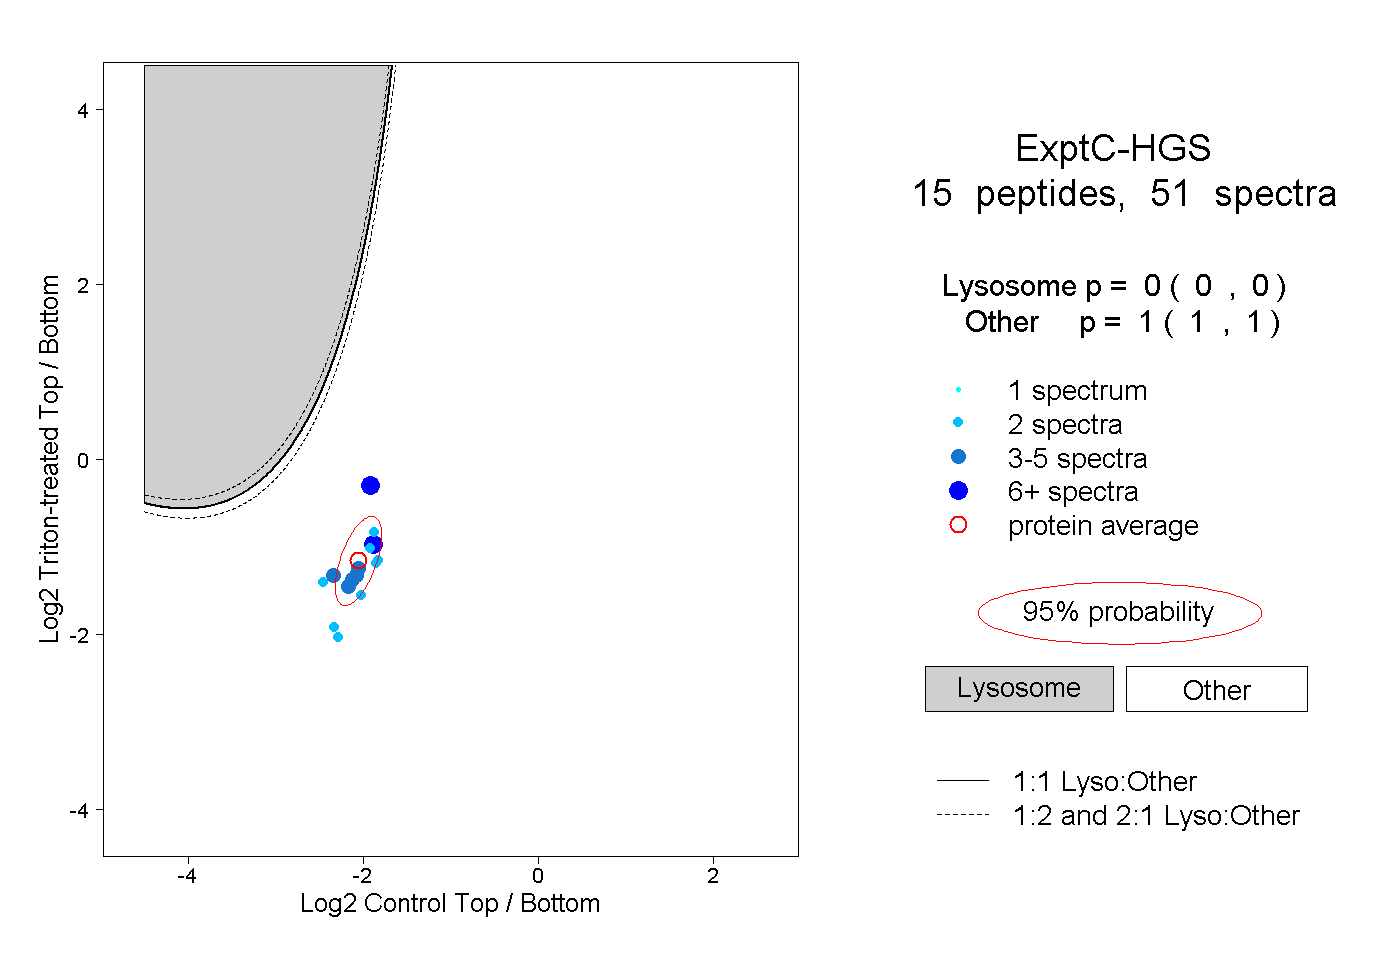
0.000 | 0.000
1.000 | 1.000
1peptide
spectra
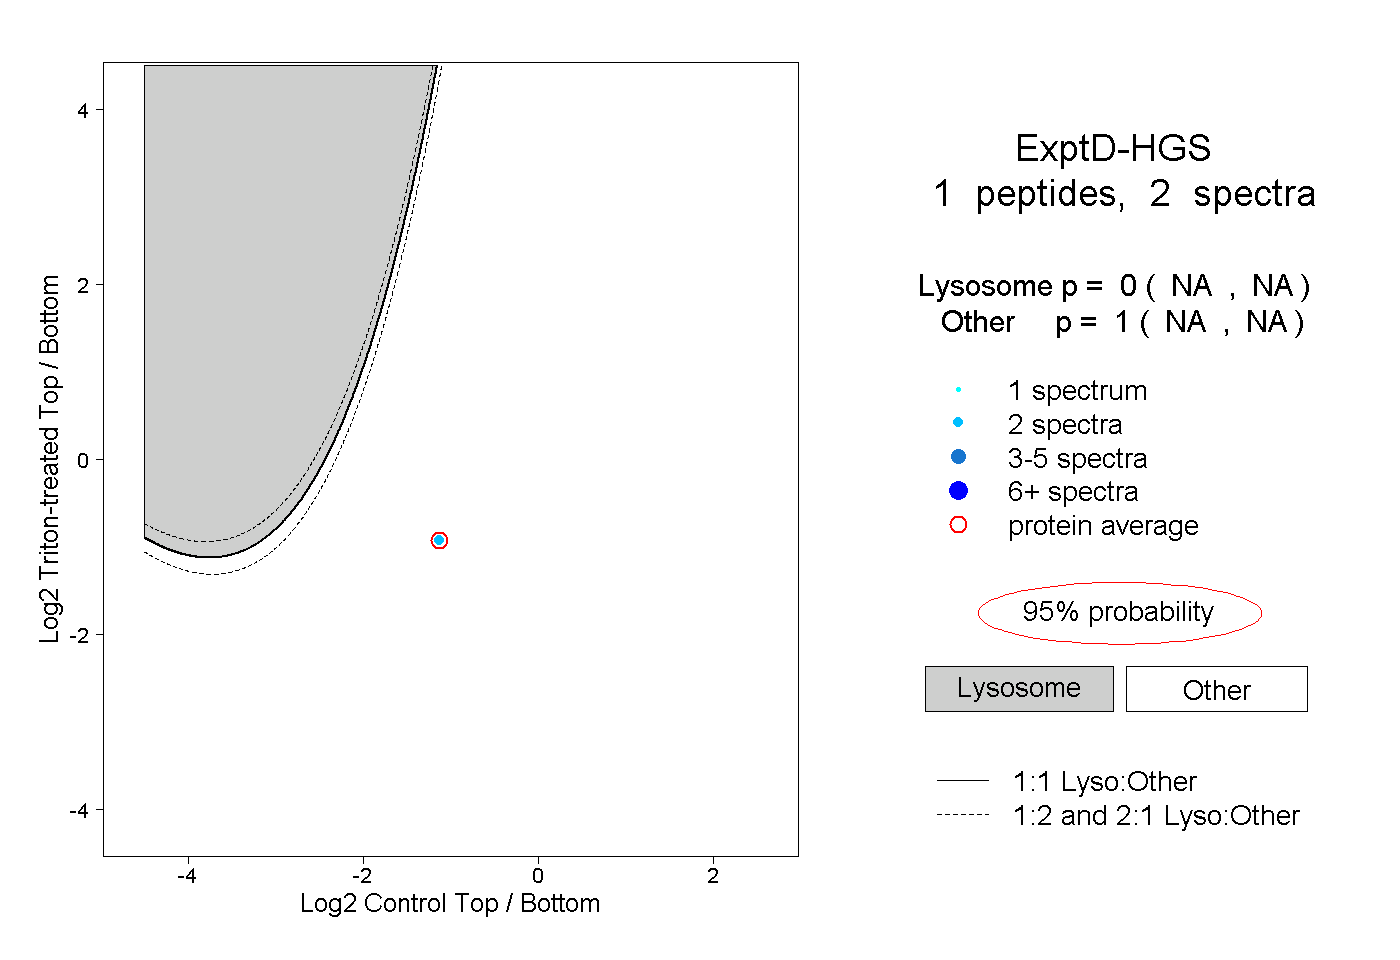
NA | NA
NA | NA