 4
4peptides
spectra
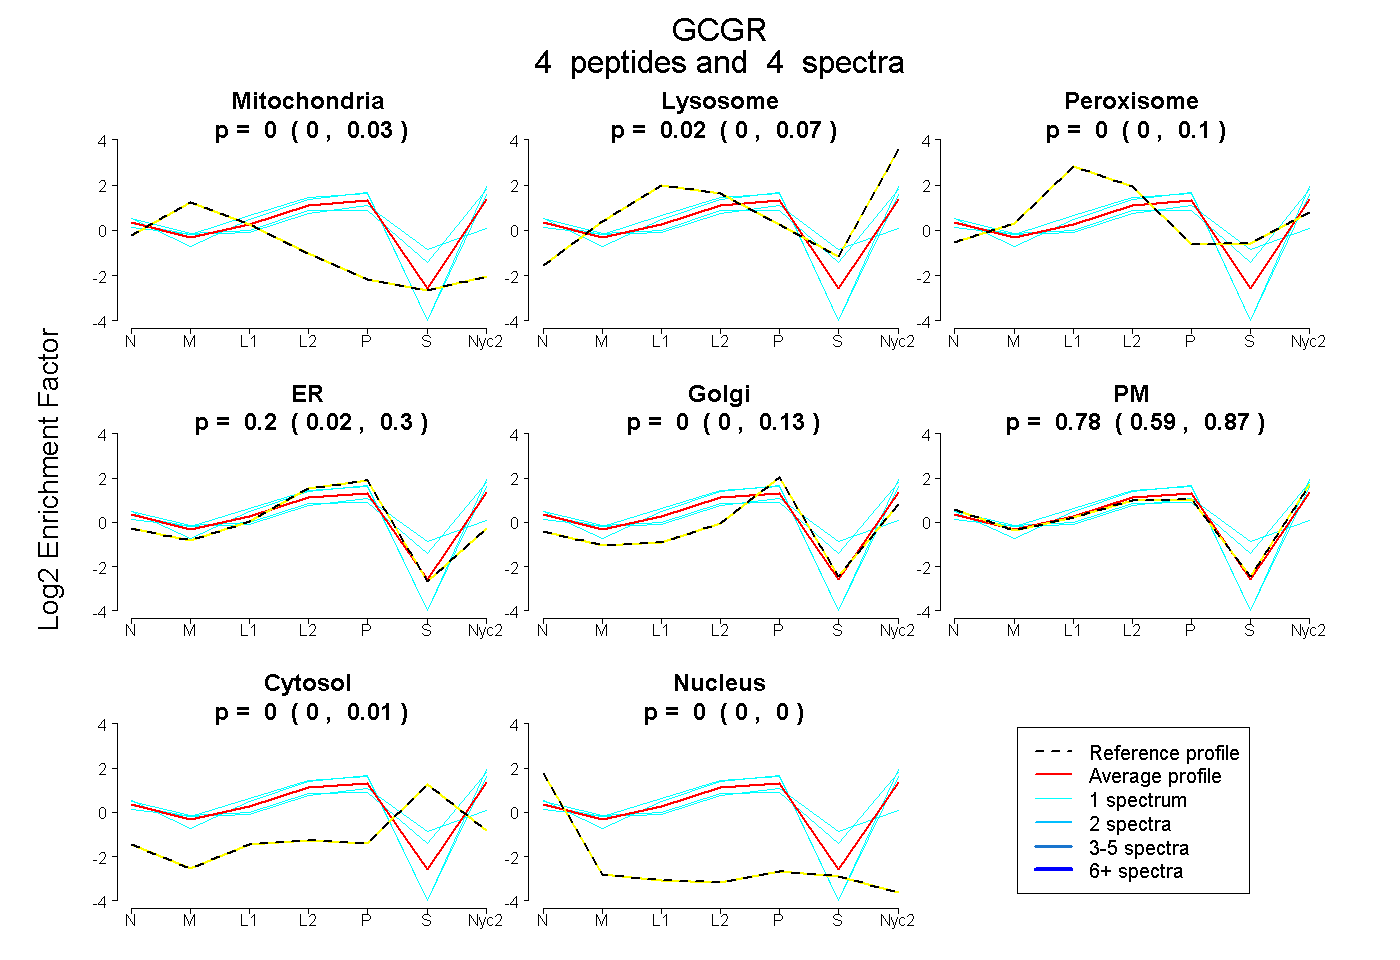
0.000 | 0.026
0.000 | 0.074
0.000 | 0.101
0.017 | 0.295
0.000 | 0.132
0.593 | 0.874
0.000 | 0.014
0.000 | 0.000
2peptides
spectra
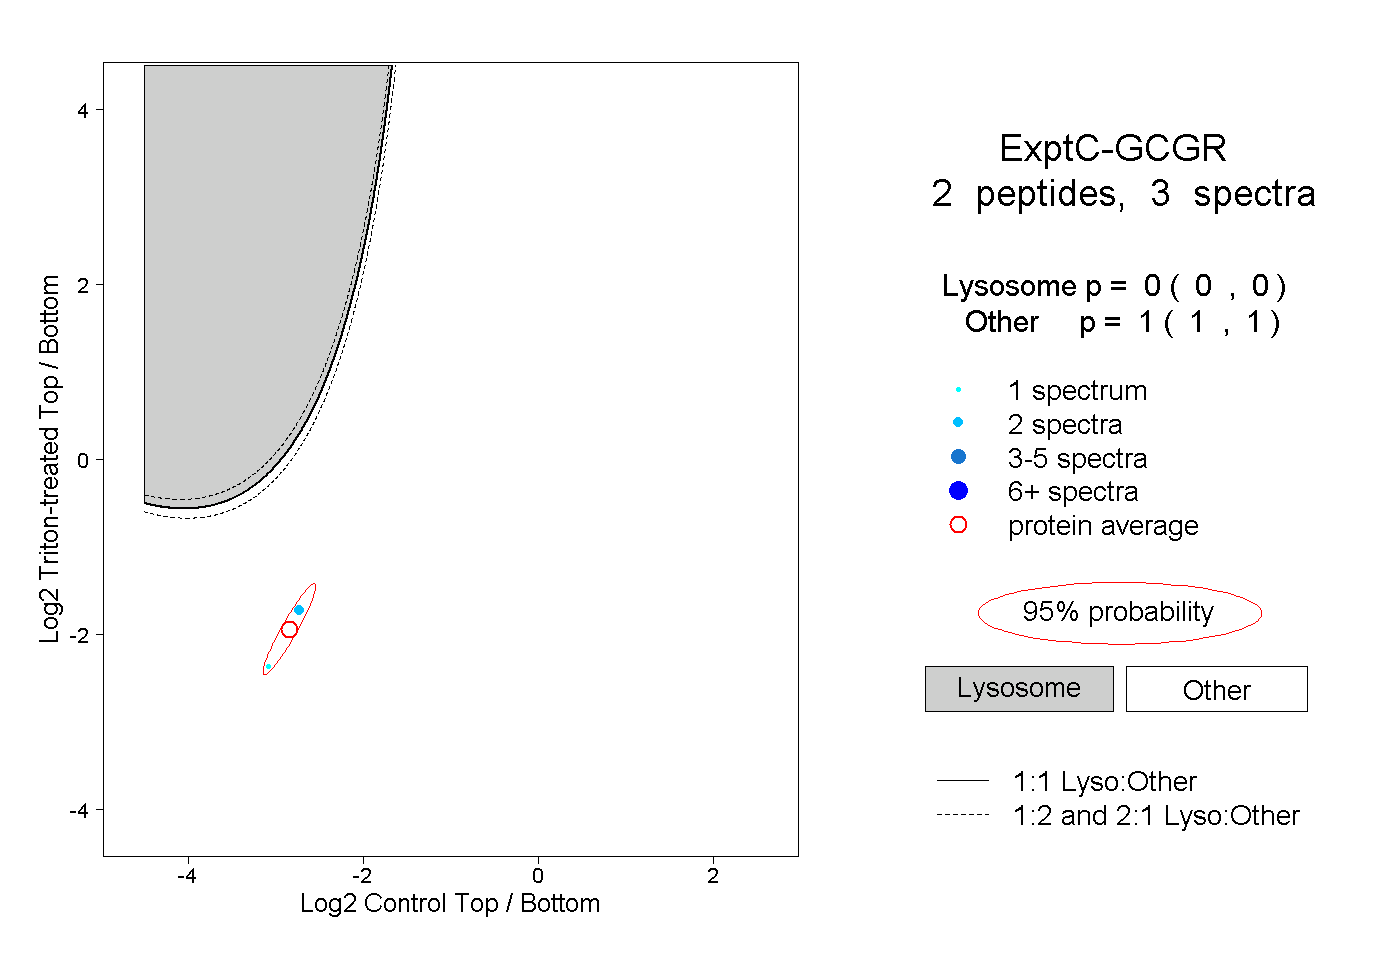
0.000 | 0.000
1.000 | 1.000
| Plot | Mito | Lyso | Perox | ER | Golgi | PM | Cytosol | Nucleus | |||||
| Expt A |
4 peptides |
4 spectra |
|
0.000 0.000 | 0.026 |
0.020 0.000 | 0.074 |
0.000 0.000 | 0.101 |
0.203 0.017 | 0.295 |
0.000 0.000 | 0.132 |
0.776 0.593 | 0.874 |
0.000 0.000 | 0.014 |
0.000 0.000 | 0.000 |
||
| Plot | Lyso | Other | |||||||||||
| Expt C |
2 peptides |
3 spectra |
|
0.000 0.000 | 0.000 |
1.000 1.000 | 1.000 |