 33
33peptides
spectra
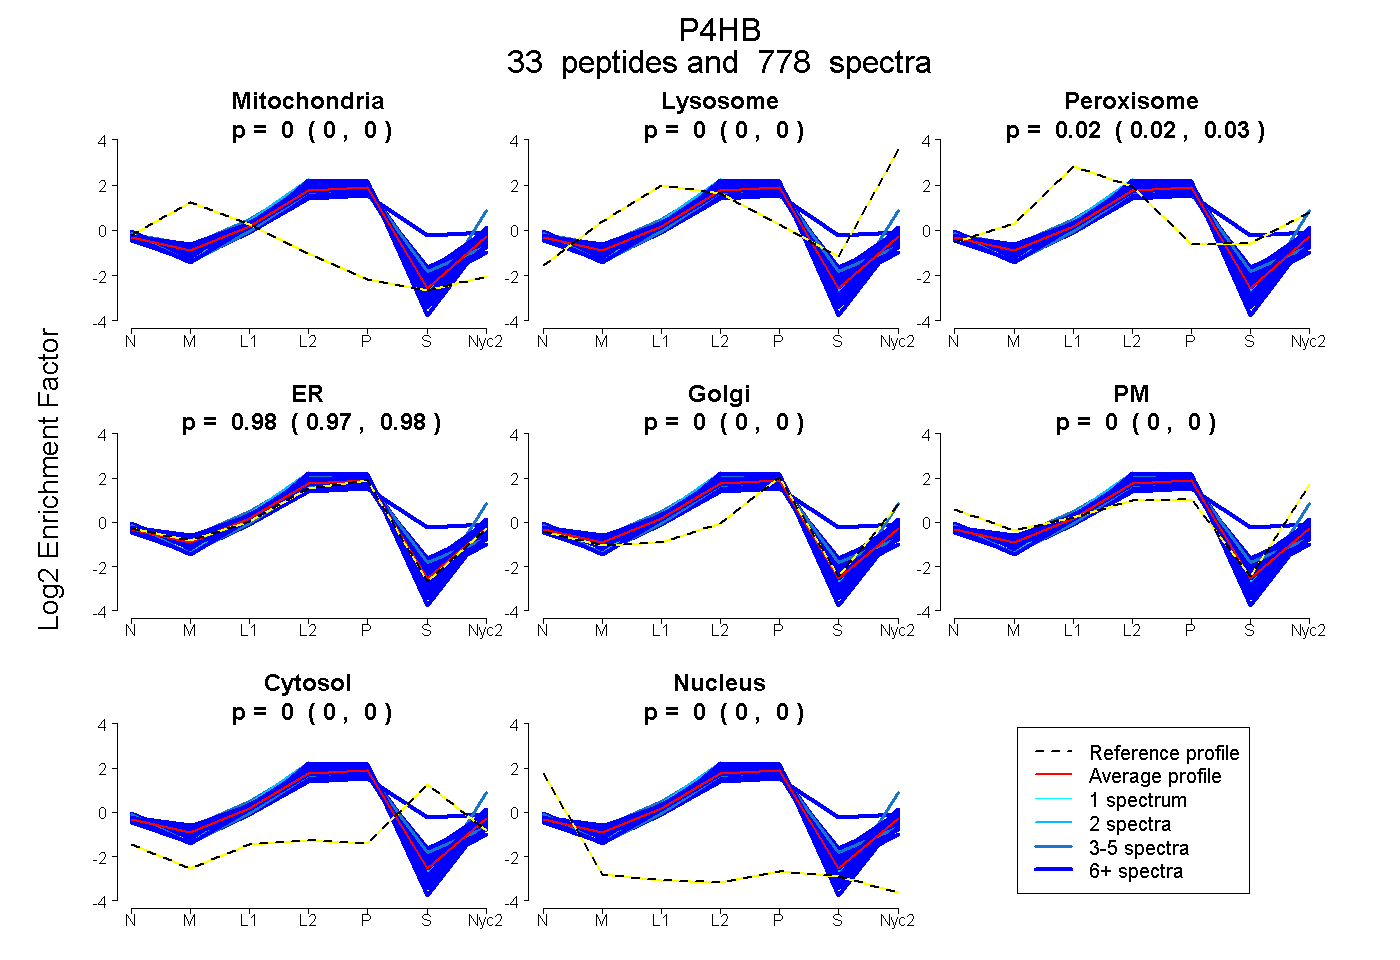
0.000 | 0.000
0.000 | 0.000
0.024 | 0.025
0.975 | 0.976
0.000 | 0.000
0.000 | 0.000
0.000 | 0.000
0.000 | 0.000
29peptides
spectra
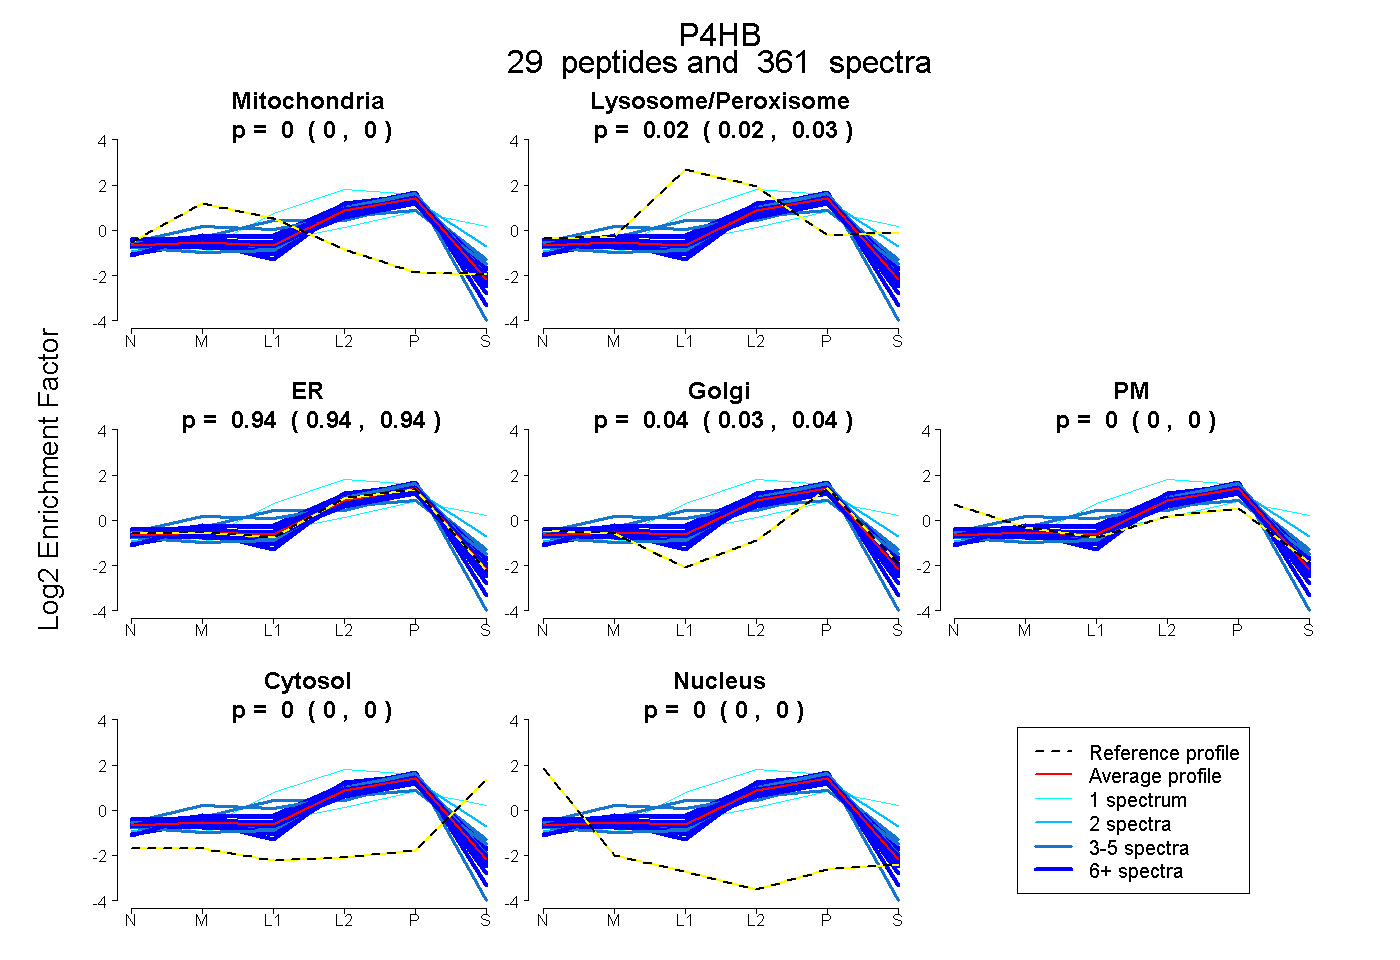
0.000 | 0.002
0.021 | 0.026
0.936 | 0.944
0.032 | 0.038
0.000 | 0.000
0.000 | 0.000
0.000 | 0.000
33peptides
spectra
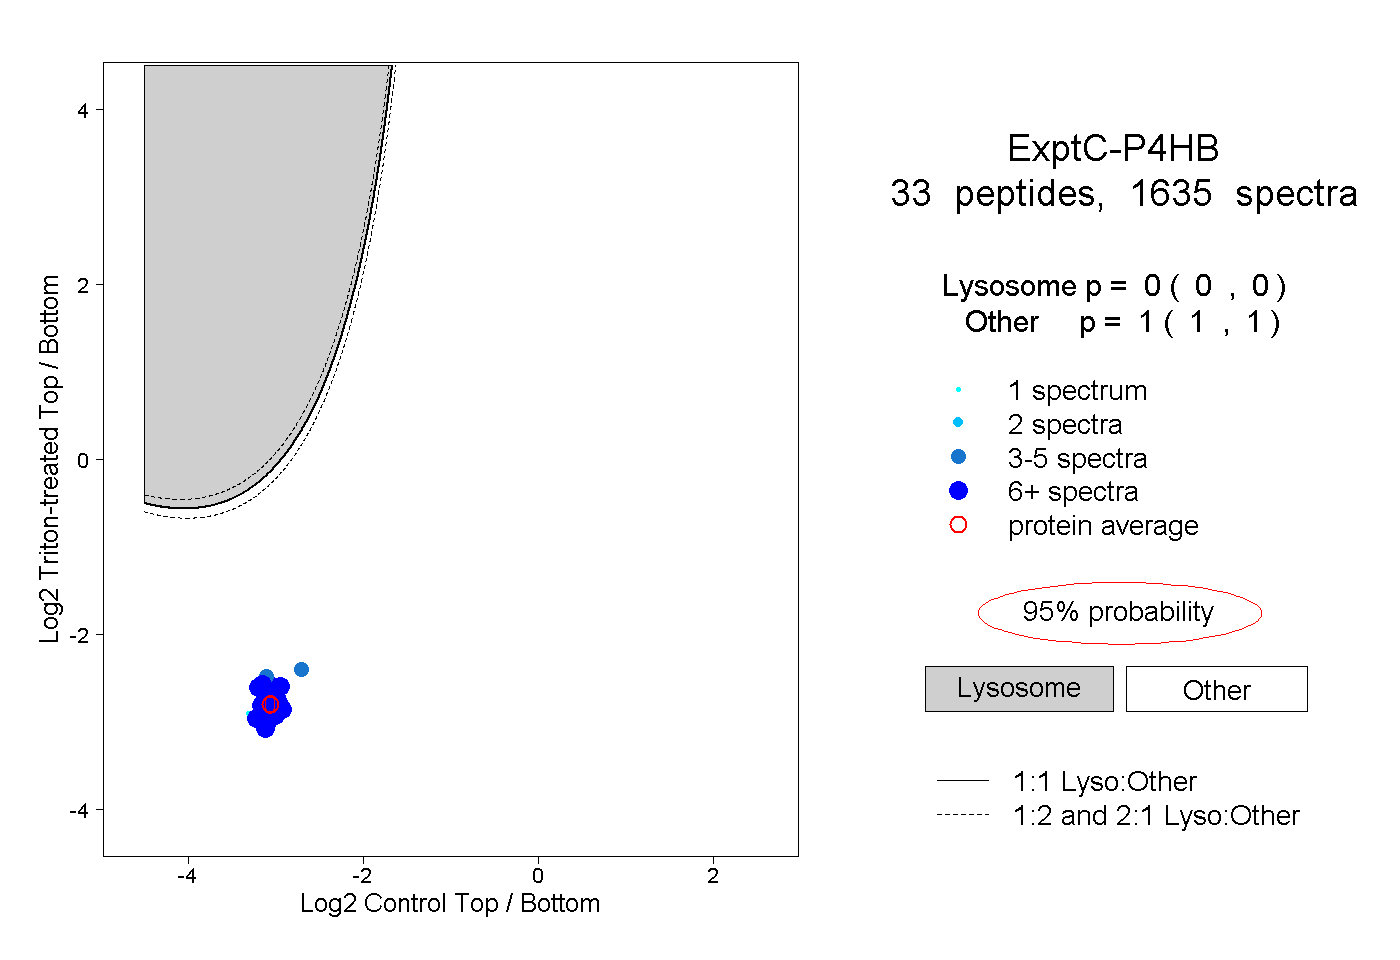
0.000 | 0.000
1.000 | 1.000
22peptides
spectra
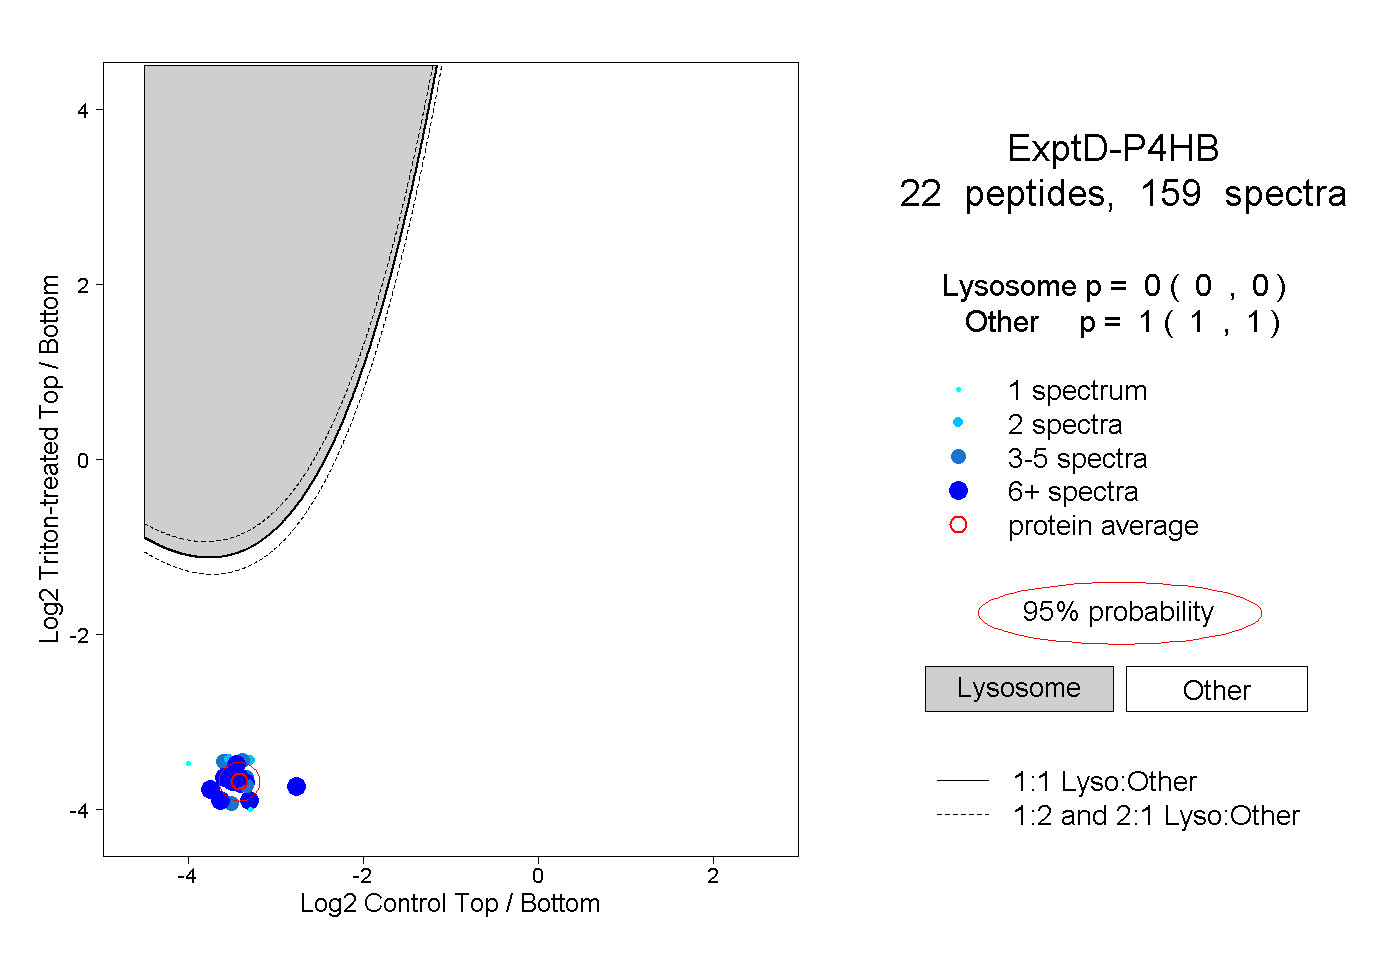
0.000 | 0.000
1.000 | 1.000