 7
7peptides
spectra
0.000 | 0.000
0.071 | 0.091
0.000 | 0.000
0.000 | 0.000
0.000 | 0.000
0.000 | 0.014
0.905 | 0.918
0.000 | 0.000
| Plot | Mito | Lyso | Perox | ER | Golgi | PM | Cytosol | Nucleus | |||||
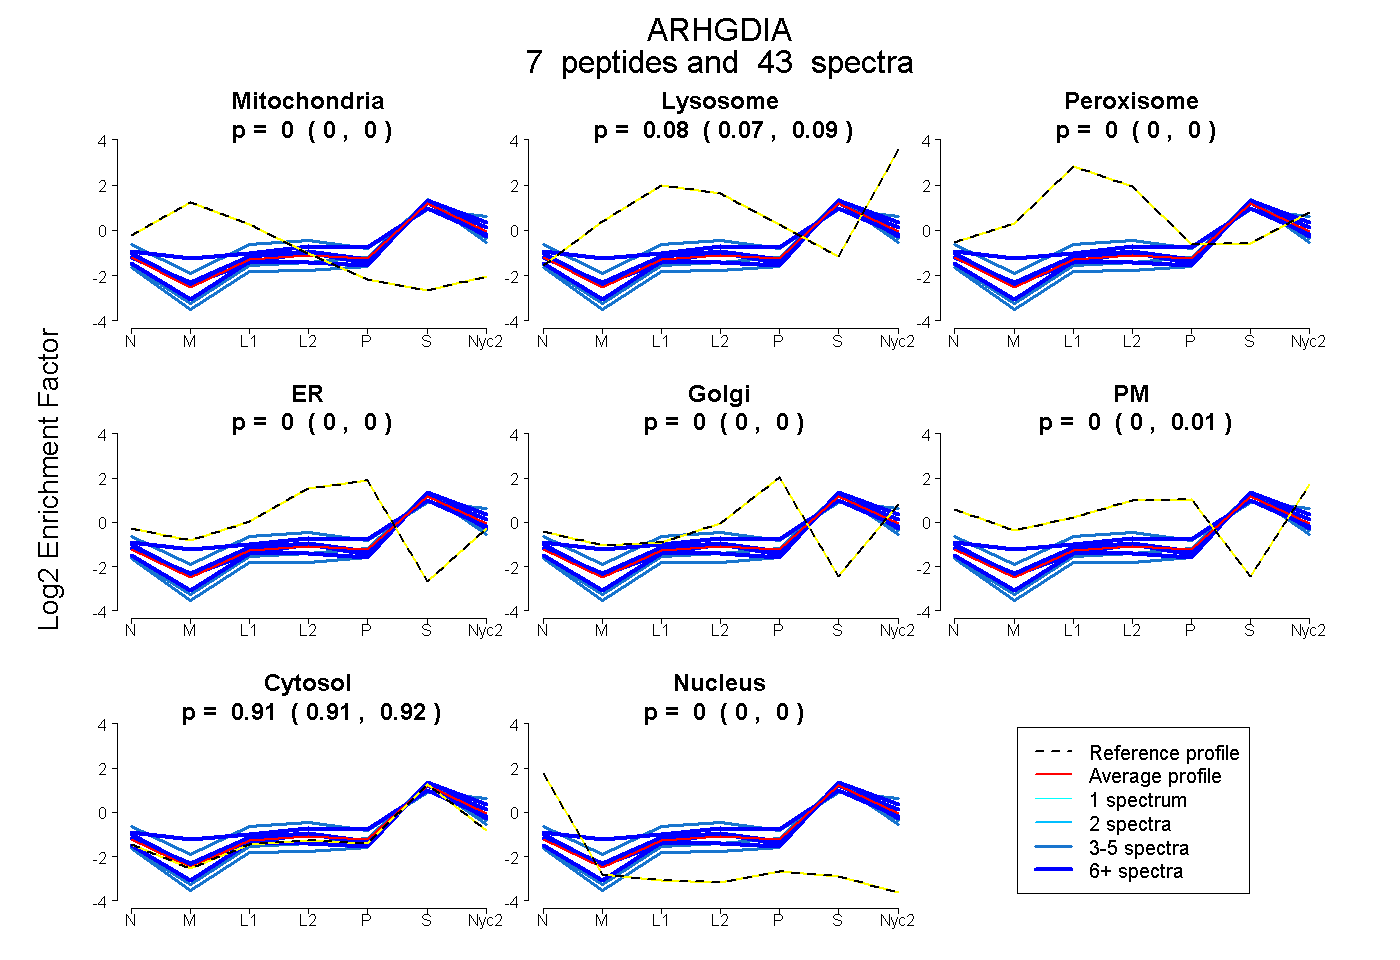
| Expt A |
7 peptides |
43 spectra |
|
0.000 0.000 | 0.000 |
0.083 0.071 | 0.091 |
0.000 0.000 | 0.000 |
0.000 0.000 | 0.000 |
0.000 0.000 | 0.000 |
0.005 0.000 | 0.014 |
0.912 0.905 | 0.918 |
0.000 0.000 | 0.000 |
| 4 spectra, AEEYEFLTPMEEAPK | 0.000 | 0.184 | 0.000 | 0.000 | 0.000 | 0.111 | 0.704 | 0.000 | ||
| 5 spectra, EALLGR | 0.000 | 0.000 | 0.000 | 0.000 | 0.000 | 0.000 | 1.000 | 0.000 | ||
| 11 spectra, YIQHTYR | 0.038 | 0.081 | 0.038 | 0.000 | 0.000 | 0.100 | 0.743 | 0.000 | ||
| 6 spectra, GSYNIK | 0.000 | 0.037 | 0.000 | 0.000 | 0.000 | 0.035 | 0.928 | 0.000 | ||
| 5 spectra, EIVSGMK | 0.000 | 0.000 | 0.000 | 0.000 | 0.000 | 0.000 | 1.000 | 0.000 | ||
| 6 spectra, TDYMVGSYGPR | 0.000 | 0.051 | 0.000 | 0.000 | 0.000 | 0.000 | 0.949 | 0.000 | ||
| 6 spectra, EGVEYR | 0.000 | 0.126 | 0.000 | 0.000 | 0.000 | 0.000 | 0.874 | 0.000 |
| Plot | Mito | Lyso or Perox | ER | Golgi | PM | Cytosol | Nucleus | ||||||
| Expt B |
4 peptides |
11 spectra |
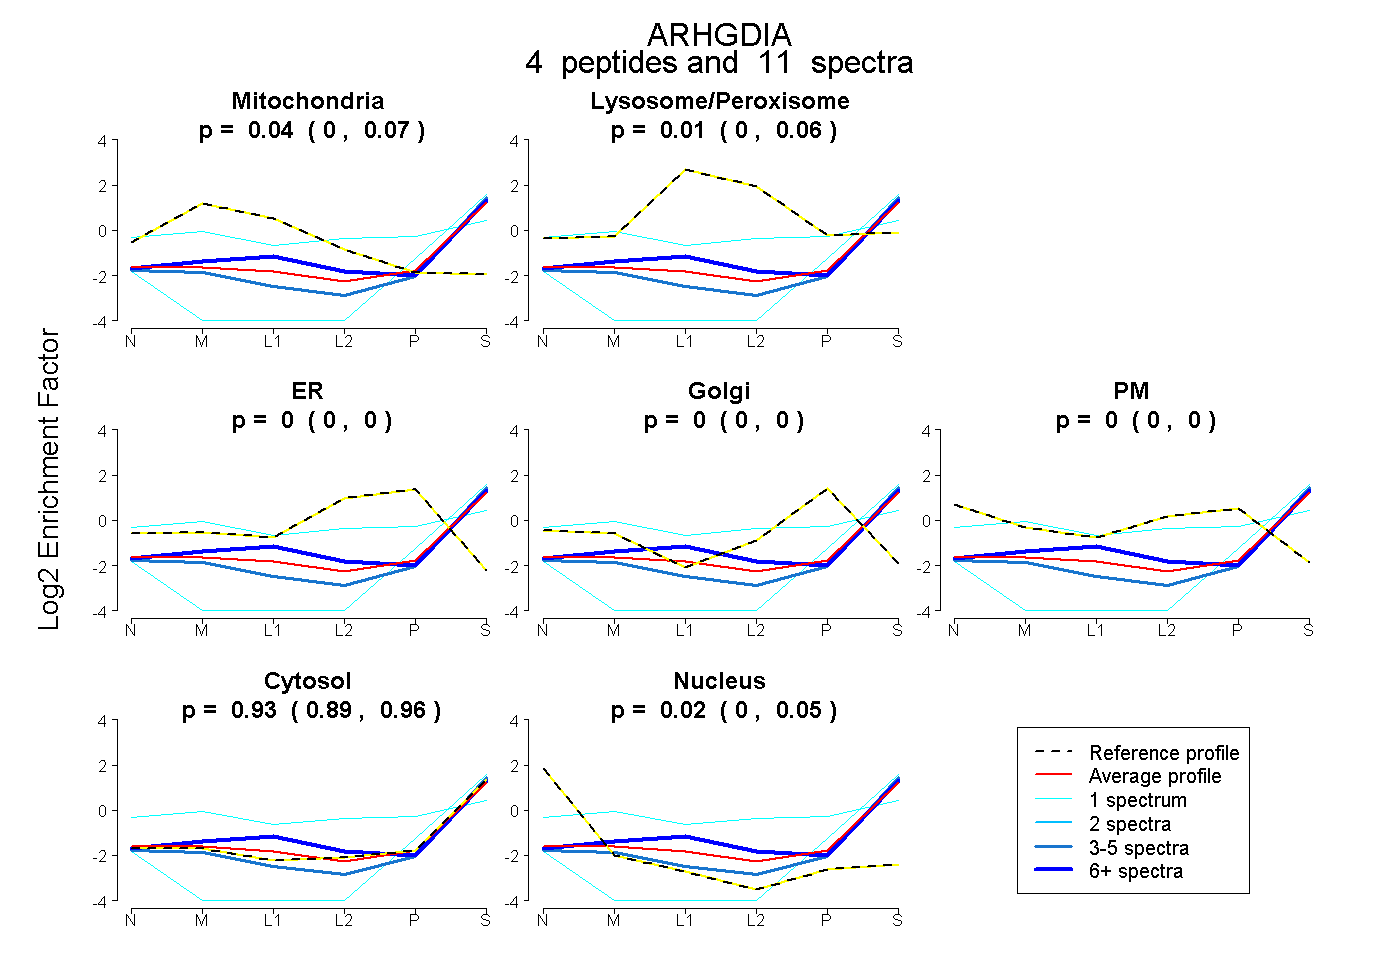 |
0.036 0.000 | 0.073 |
0.013 0.000 | 0.063 |
0.000 0.000 | 0.000 |
0.000 0.000 | 0.003 |
0.000 0.000 | 0.000 |
0.934 0.893 | 0.964 |
0.017 0.000 | 0.048 |
|||
| Plot | Lyso | Other | |||||||||||
| Expt C |
7 peptides |
60 spectra |
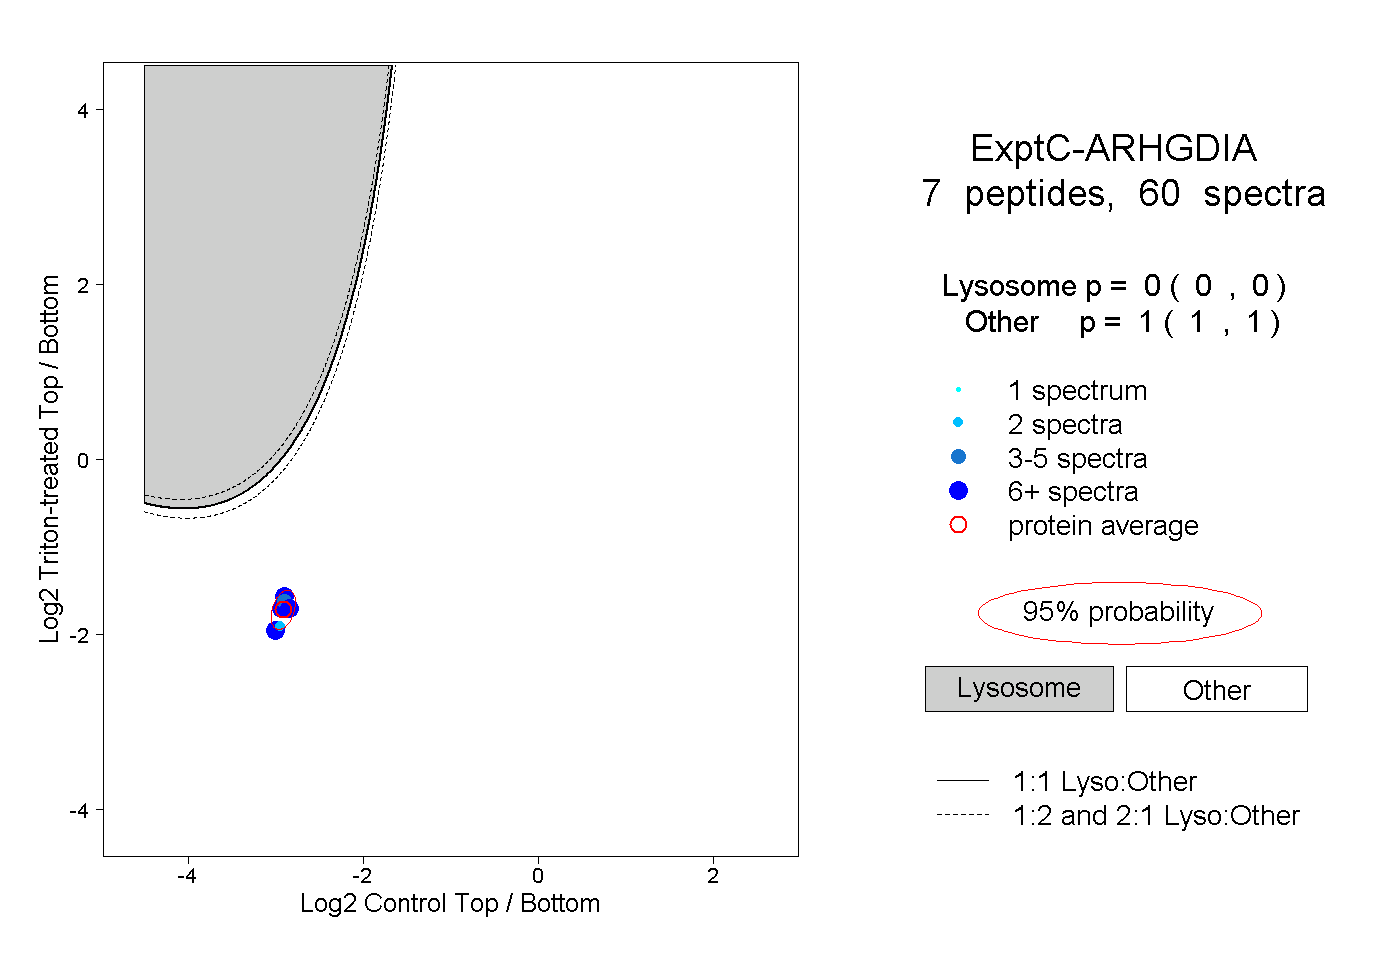 |
0.000 0.000 | 0.000 |
1.000 1.000 | 1.000 |
||||||||
| Plot | Lyso | Other | |||||||||||
| Expt D |
3 peptides |
7 spectra |
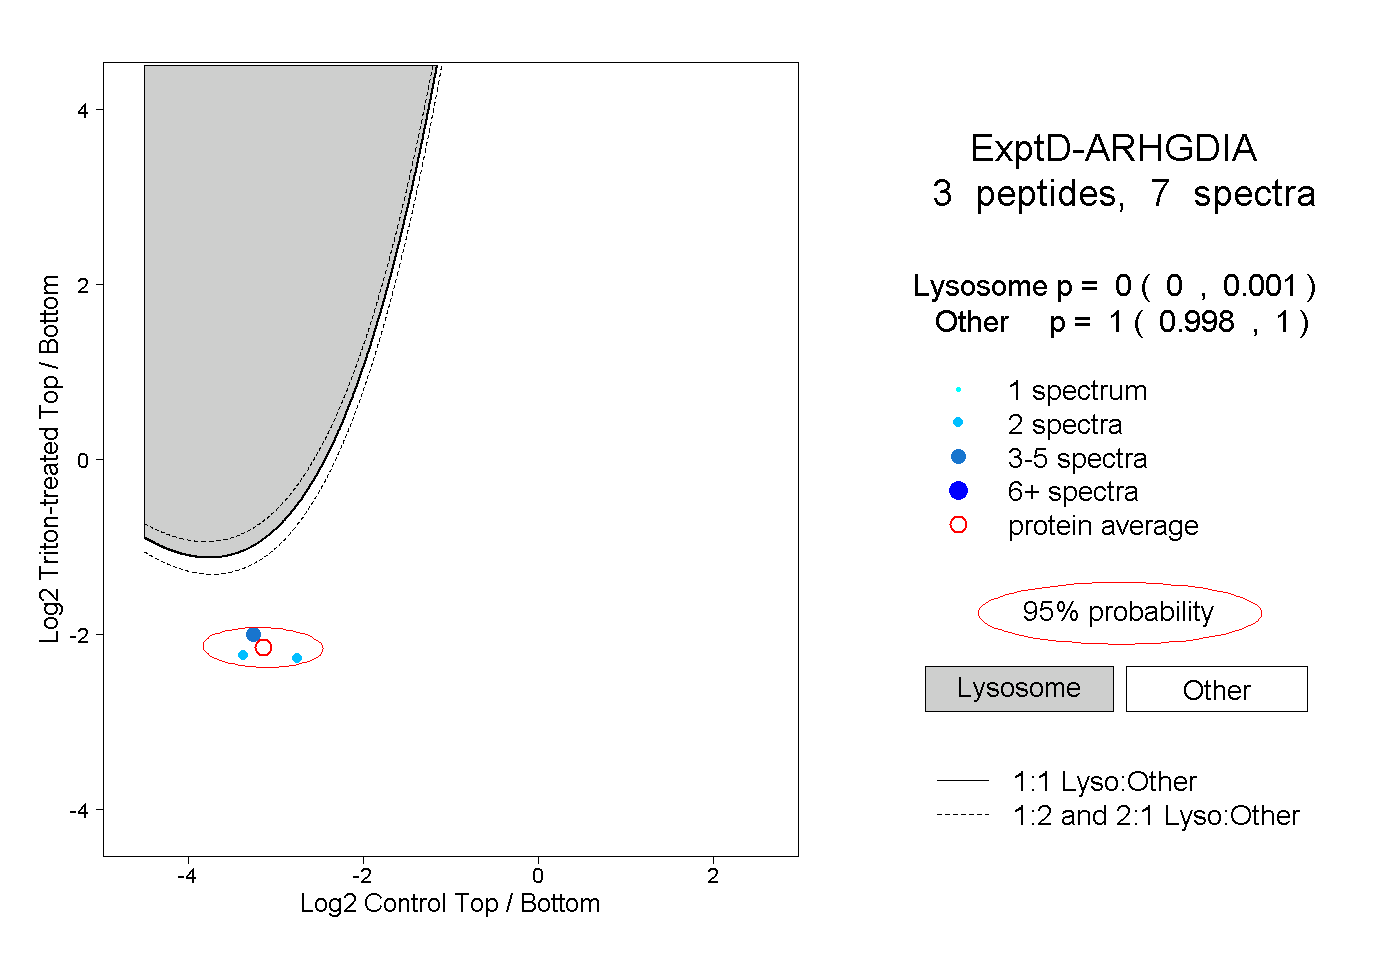 |
0.000 0.000 | 0.001 |
1.000 0.998 | 1.000 |