ASPSCR1
[ENSRNOP00000051827]
Main page
| | | Plot |
Mito |
Lyso |
|
Perox |
ER |
Golgi |
PM |
Cytosol |
Nucleus |
|
| Expt A |
 15
15
peptides |
23
spectra |
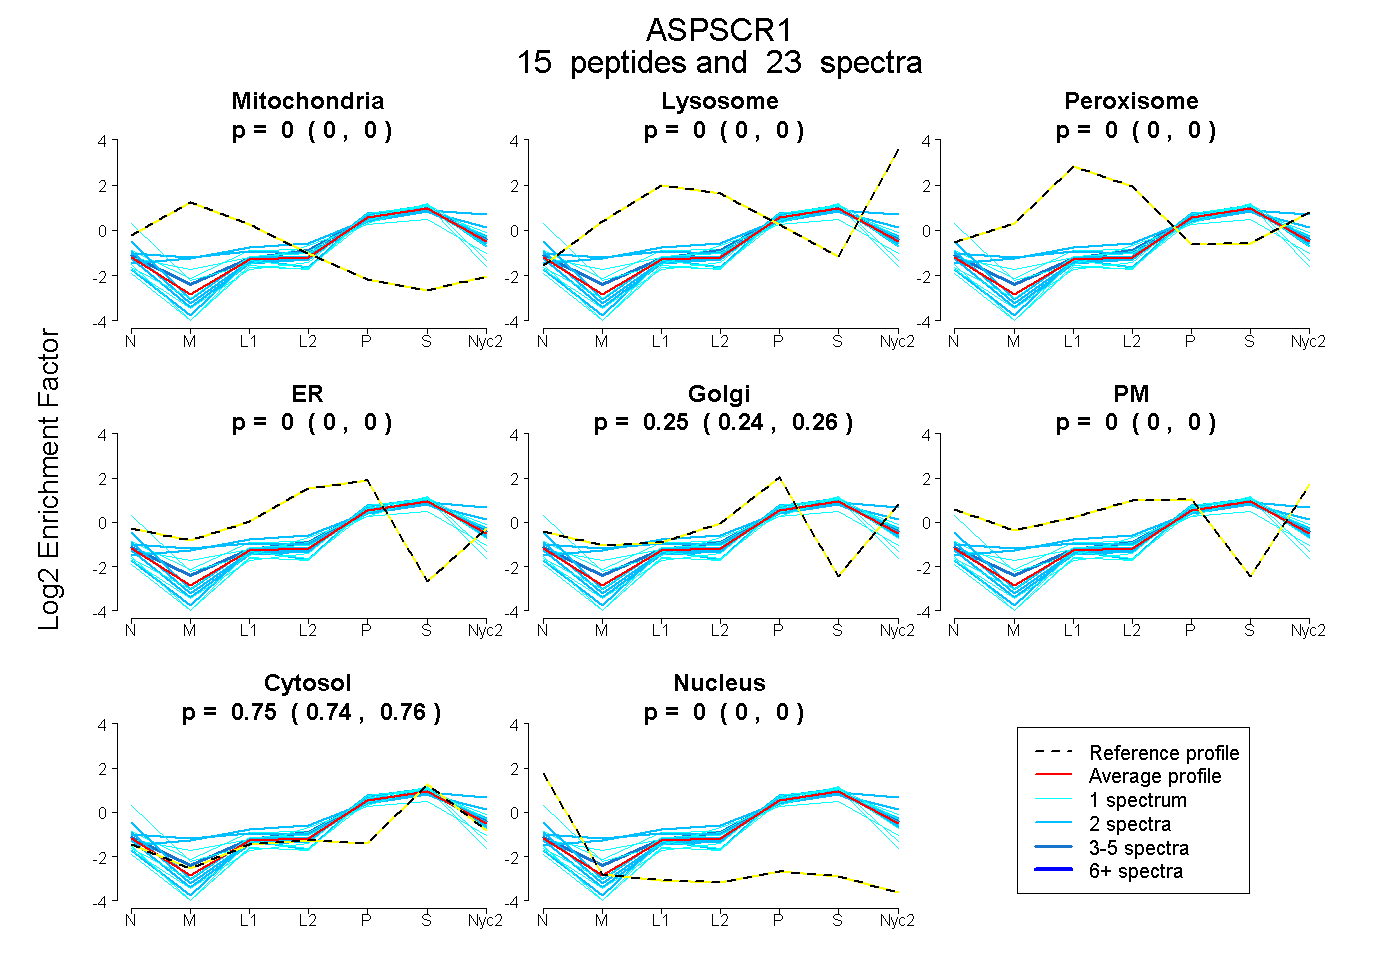 |
0.000
0.000 | 0.000 |
0.000
0.000 | 0.000 |
|
0.000
0.000 | 0.000 |
0.000
0.000 | 0.000 |
0.251
0.244 | 0.256 |
0.000
0.000 | 0.000 |
0.749
0.743 | 0.755 |
0.000
0.000 | 0.000 |
|
| | | Plot |
Mito |
|
Lyso or Perox |
|
ER |
Golgi |
PM |
Cytosol |
Nucleus |
|
| Expt B |
5
peptides |
8
spectra |
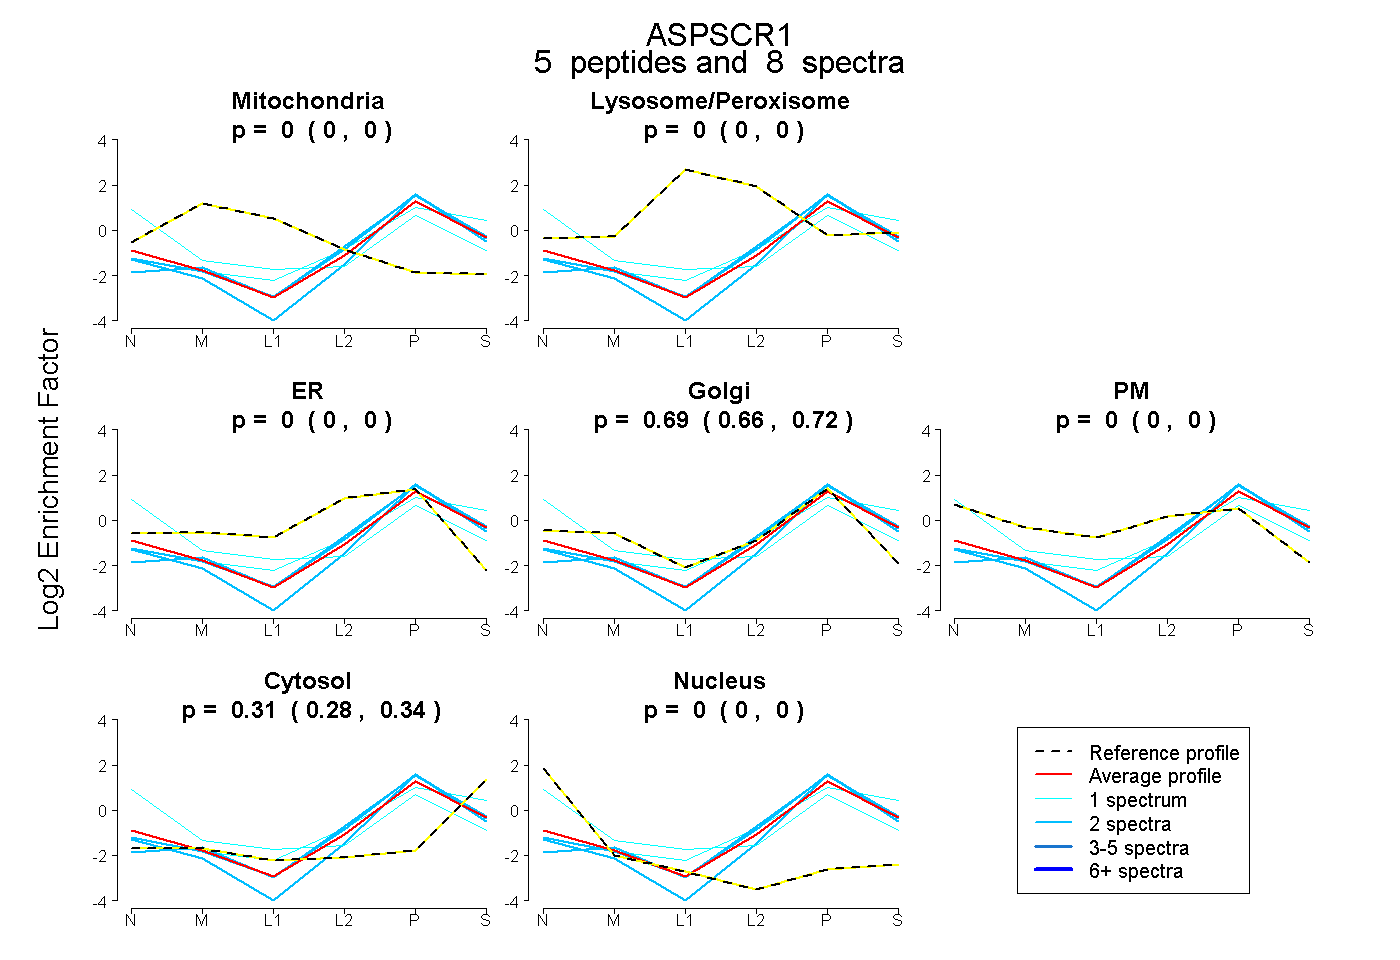 |
0.000
0.000 | 0.000 |
|
0.000
0.000 | 0.000 |
|
0.000
0.000 | 0.000 |
0.689
0.657 | 0.715 |
0.000
0.000 | 0.000 |
0.311
0.281 | 0.337 |
0.000
0.000 | 0.000 |
|
| 2 spectra, VLFPDR |
0.000 |
|
0.000 |
|
0.000 |
0.745 |
0.000 |
0.255 |
0.000 |
|
| 1 spectrum, LQDSFCSR |
0.000 |
|
0.000 |
|
0.000 |
0.402 |
0.280 |
0.121 |
0.197 |
|
| 1 spectrum, IALQLDDGCR |
0.000 |
|
0.000 |
|
0.126 |
0.428 |
0.000 |
0.446 |
0.000 |
|
| 2 spectra, LQQLGER |
0.000 |
|
0.000 |
|
0.000 |
0.692 |
0.000 |
0.308 |
0.000 |
|
| 2 spectra, LGGPSVSLR |
0.000 |
|
0.000 |
|
0.000 |
0.674 |
0.000 |
0.326 |
0.000 |
|
| | | Plot |
|
Lyso |
|
|
|
|
|
|
|
Other |
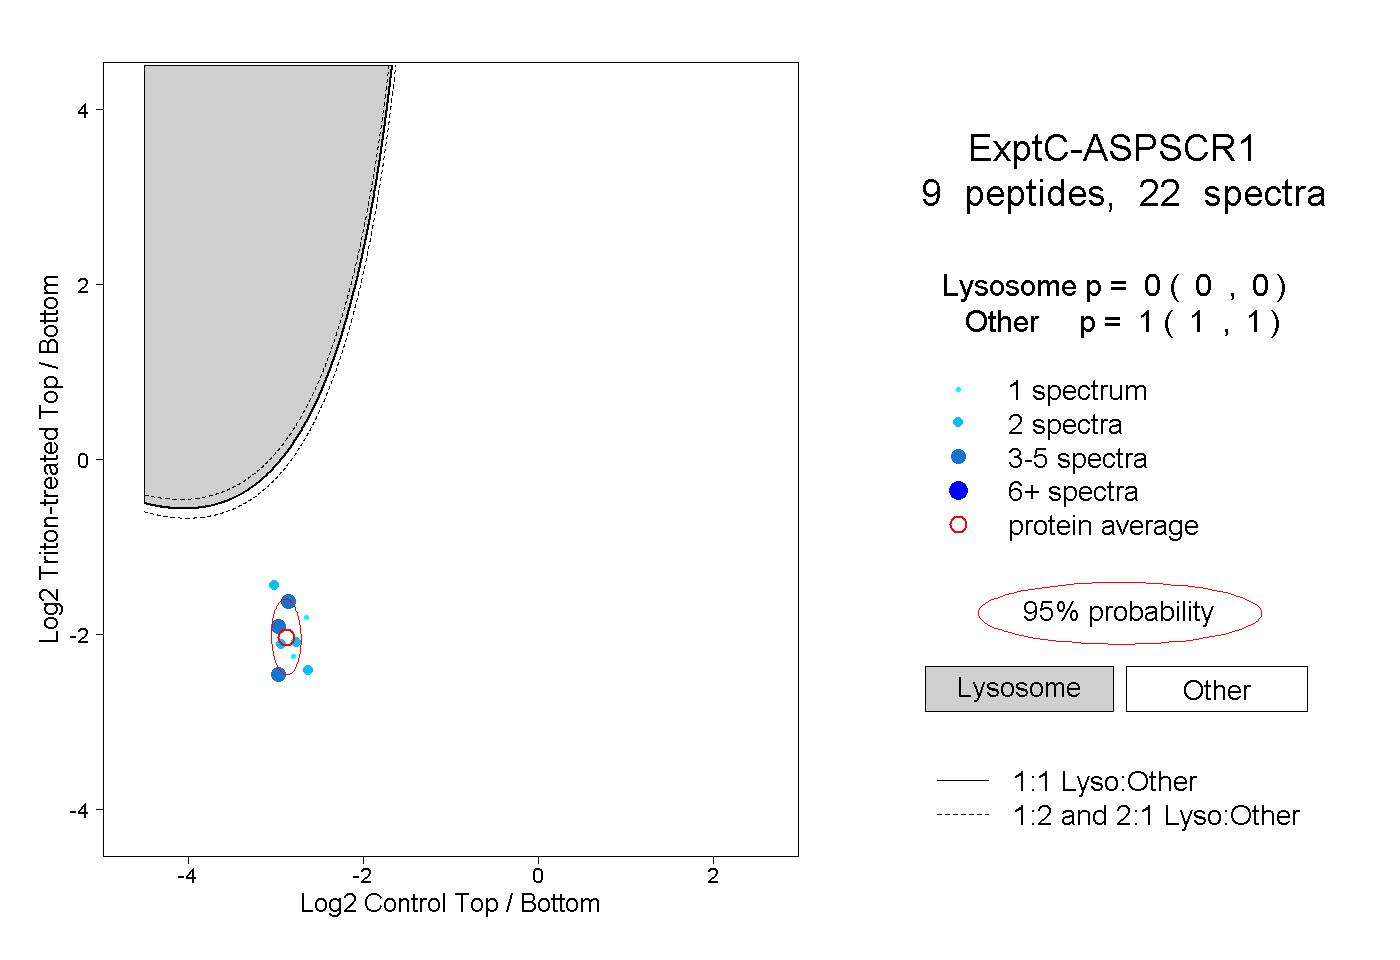
| Expt C |
9
peptides |
22
spectra |
 |
|
0.000
0.000 | 0.000 |
|
|
|
|
|
|
|
1.000
1.000 | 1.000 |
| | | Plot |
|
Lyso |
|
|
|
|
|
|
|
Other |
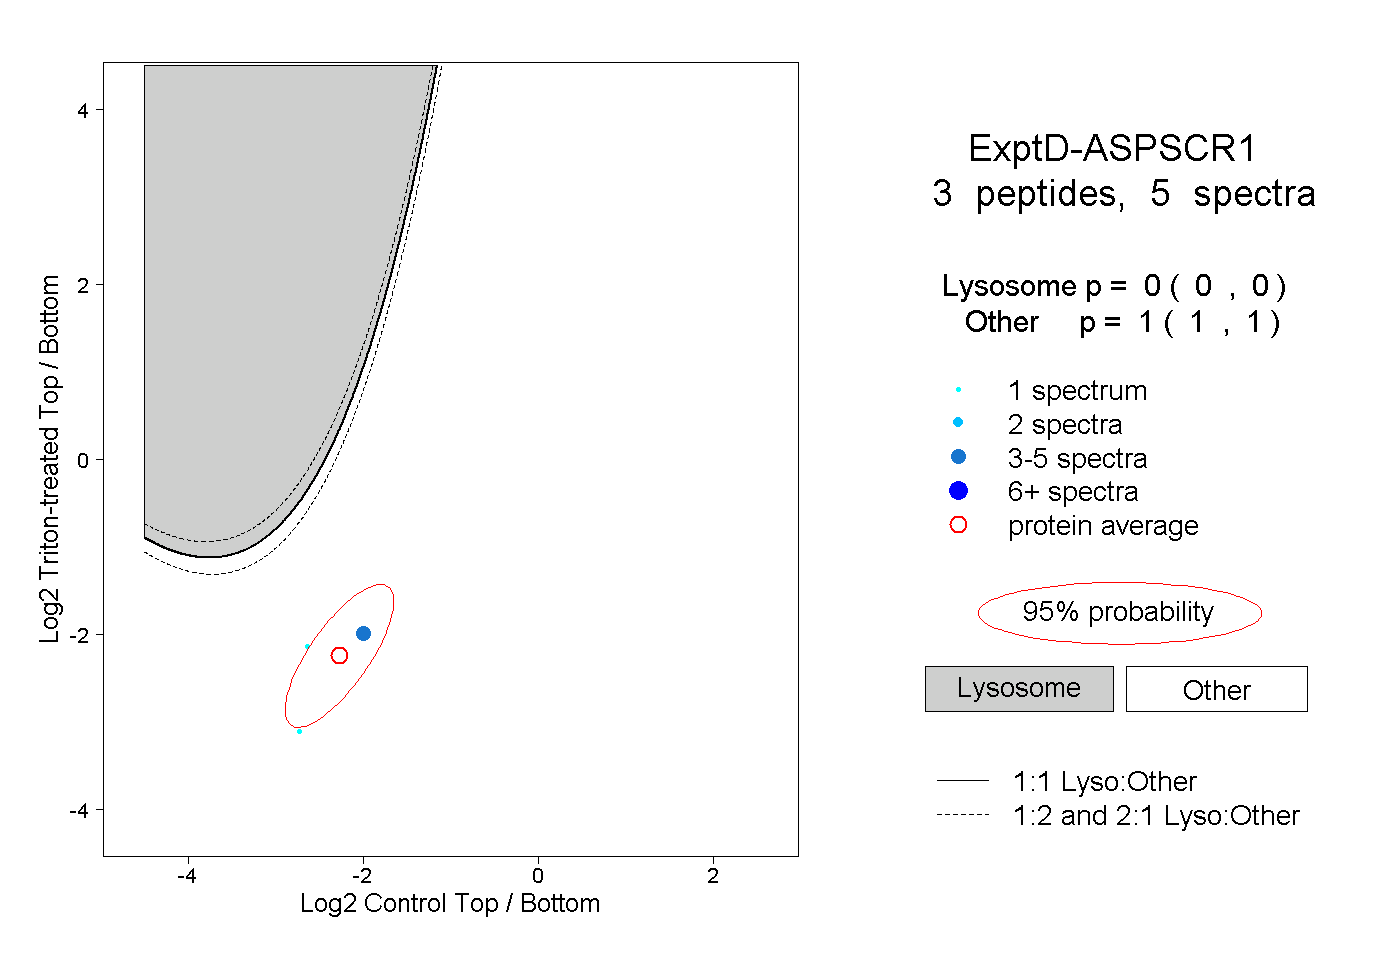
| Expt D |
3
peptides |
5
spectra |
 |
|
0.000
0.000 | 0.000 |
|
|
|
|
|
|
|
1.000
1.000 | 1.000 |