 3
3peptides
spectra
0.000 | 0.000
0.000 | 0.000
0.000 | 0.117
0.000 | 0.274
0.000 | 0.306
0.000 | 0.442
0.396 | 0.536
0.000 | 0.136
1peptide
spectrum
NA | NA
NA | NA
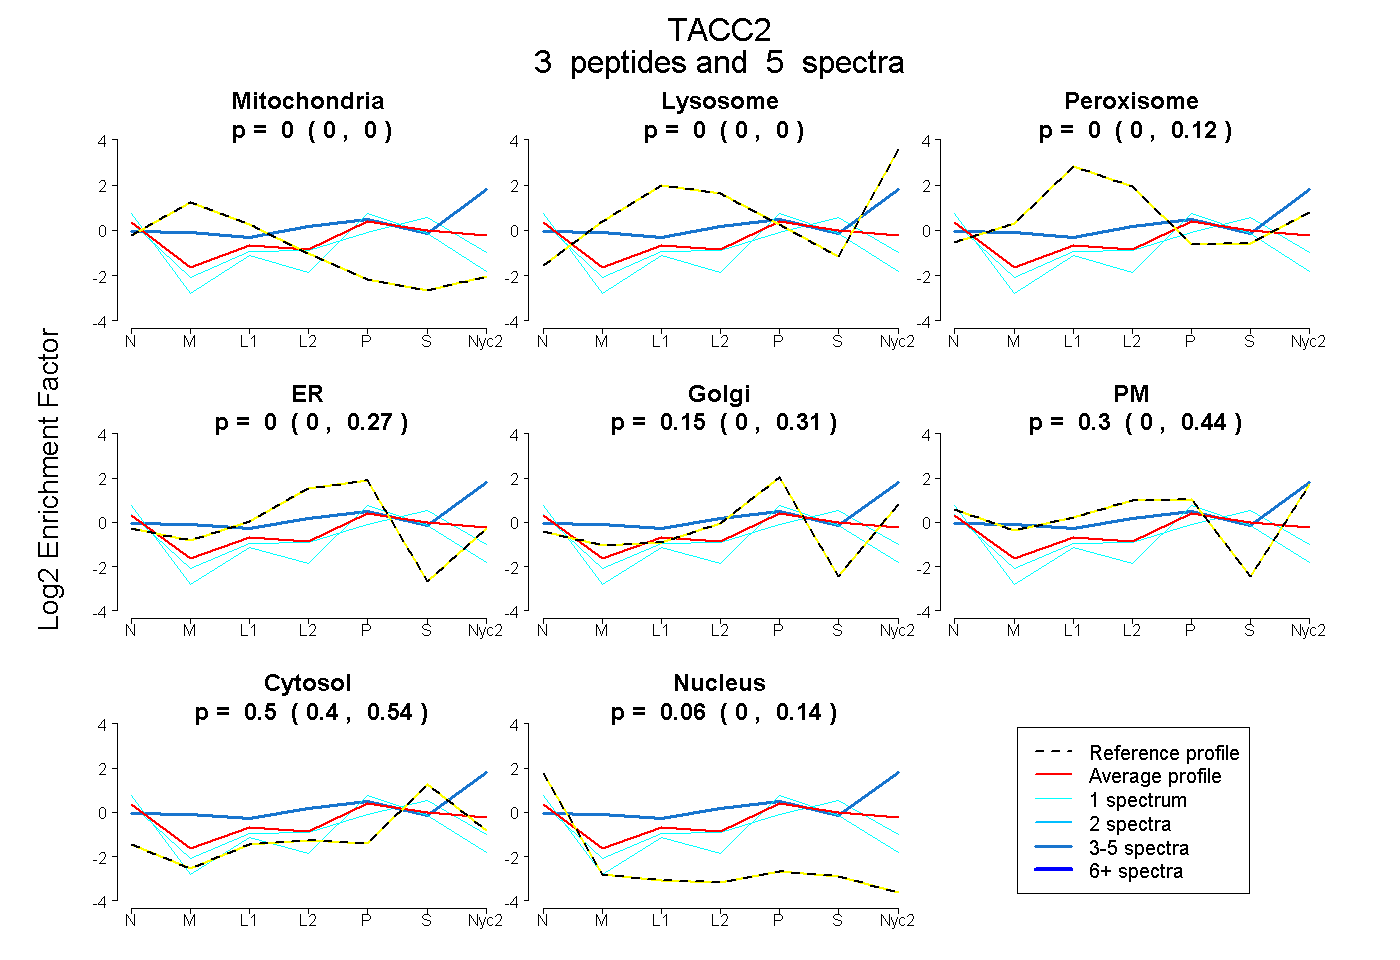
| Plot | Mito | Lyso | Perox | ER | Golgi | PM | Cytosol | Nucleus | |||||
| Expt A |
3 peptides |
5 spectra |
|
0.000 0.000 | 0.000 |
0.000 0.000 | 0.000 |
0.000 0.000 | 0.117 |
0.000 0.000 | 0.274 |
0.149 0.000 | 0.306 |
0.297 0.000 | 0.442 |
0.496 0.396 | 0.536 |
0.058 0.000 | 0.136 |
||
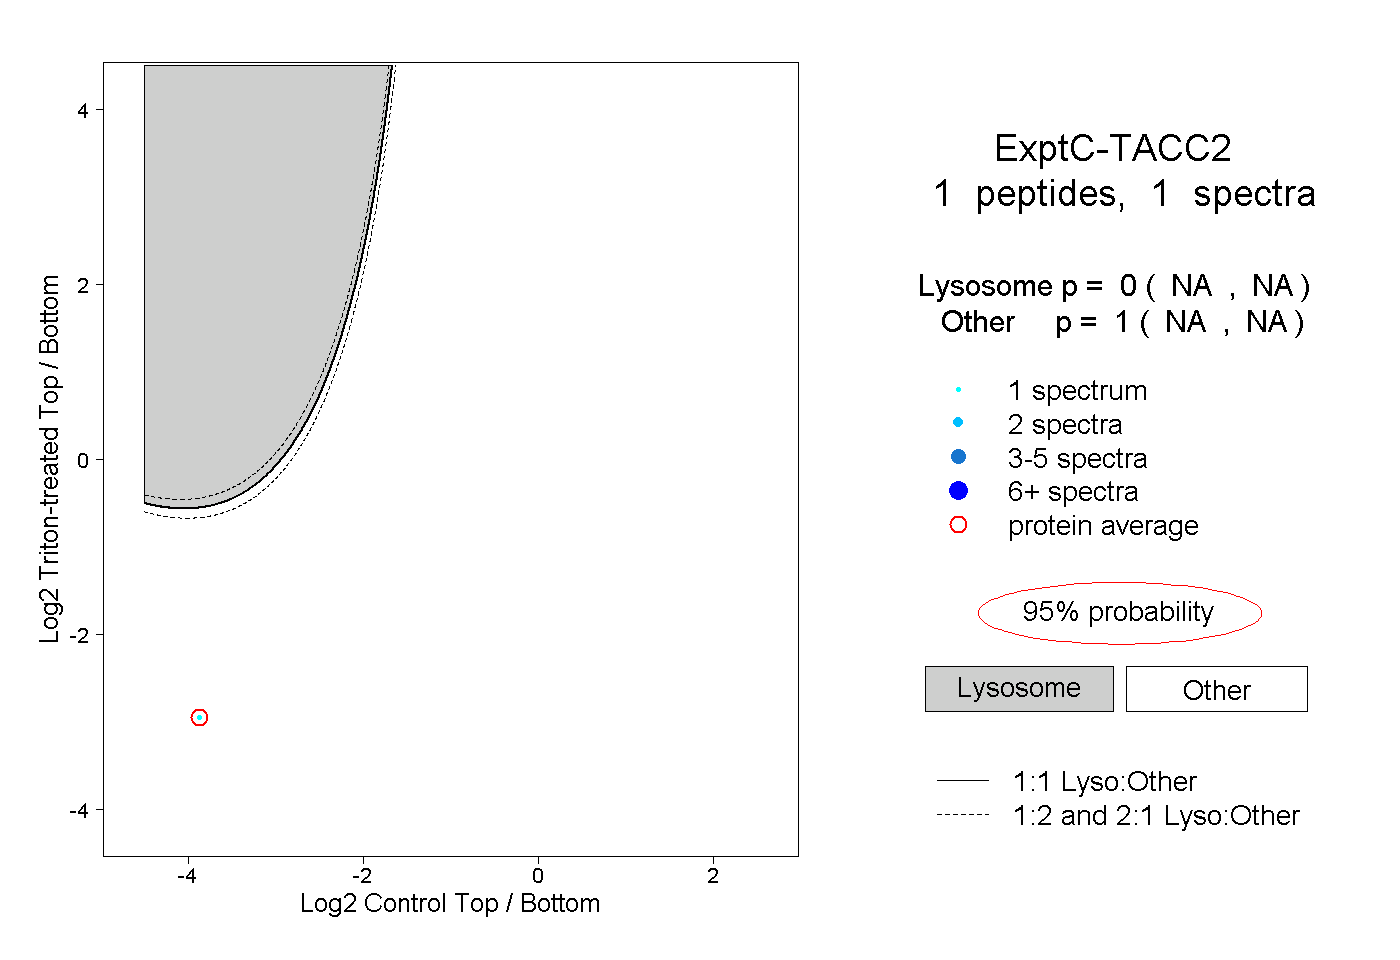
| Plot | Lyso | Other | |||||||||||
| Expt C |
1 peptide |
1 spectrum |
|
0.000 NA | NA |
1.000 NA | NA |