 5
5peptides
spectra
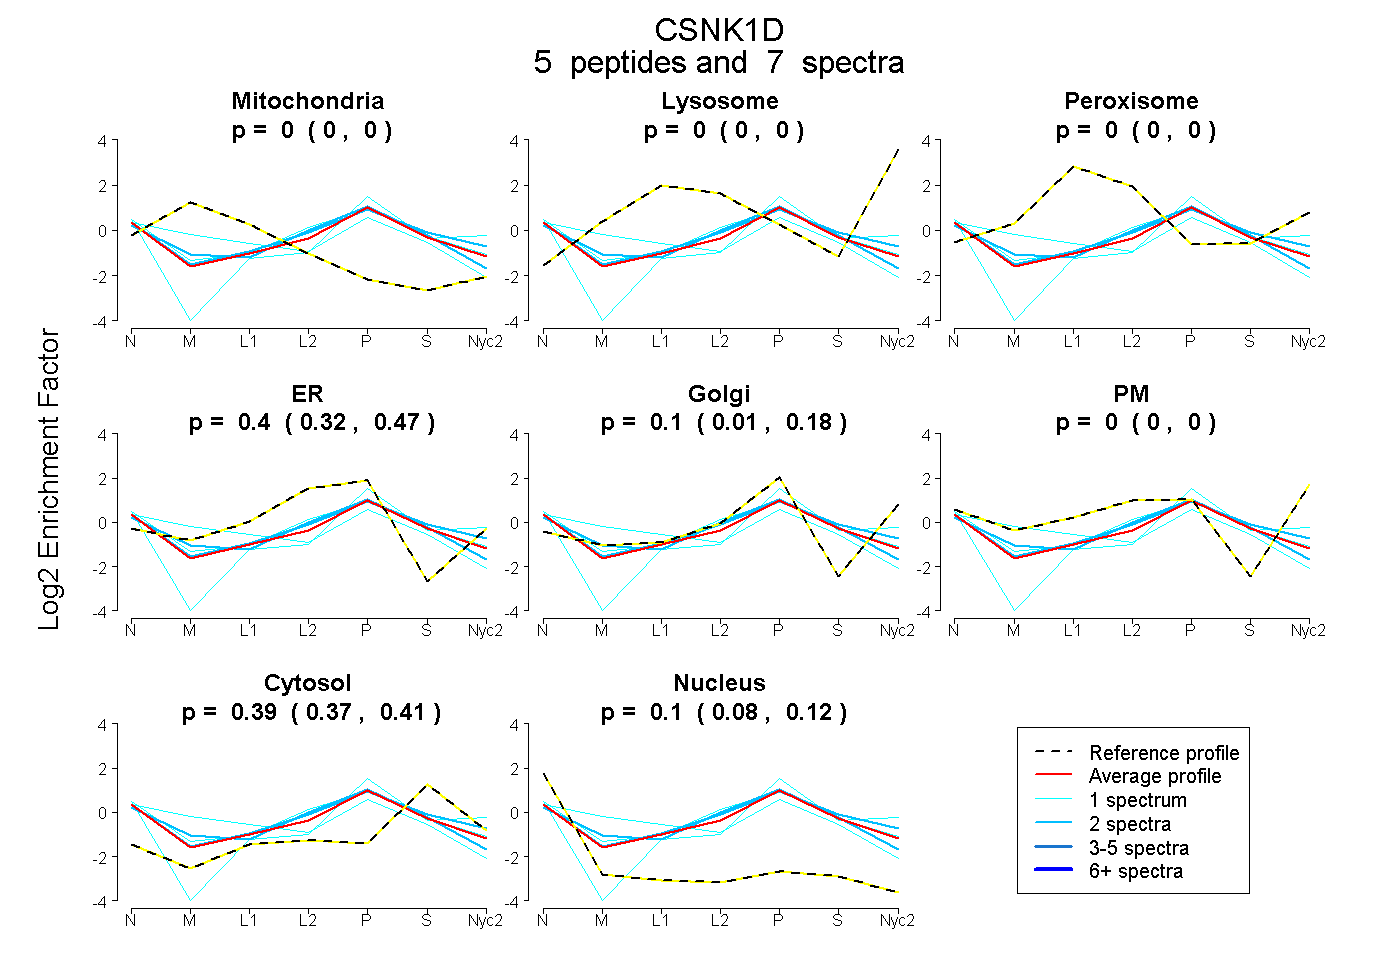
0.000 | 0.000
0.000 | 0.000
0.000 | 0.000
0.317 | 0.465
0.009 | 0.178
0.000 | 0.000
0.372 | 0.411
0.082 | 0.122
2peptides
spectra
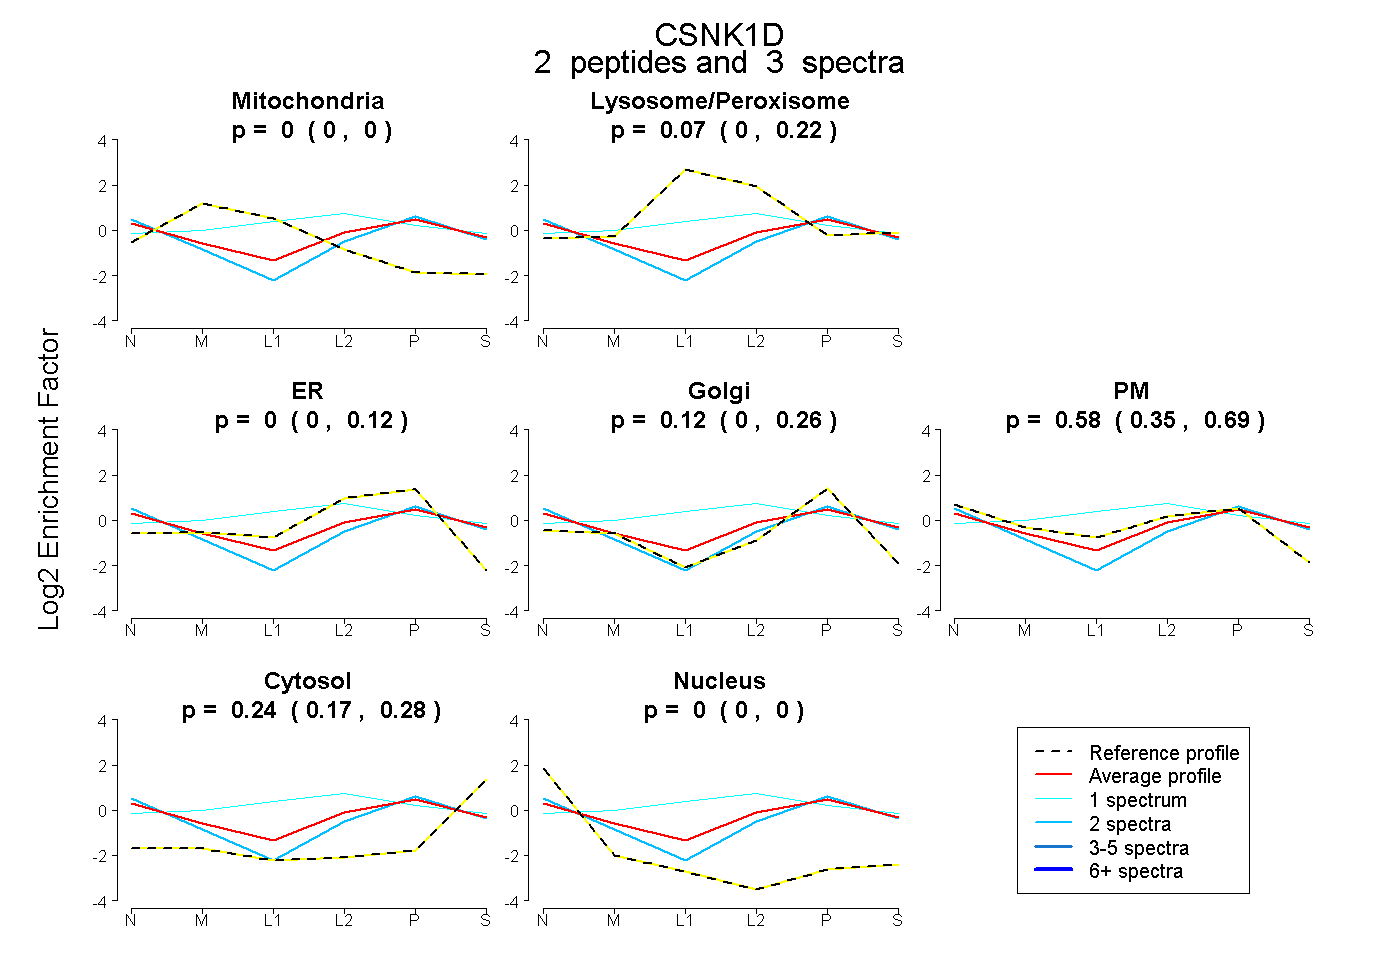
0.000 | 0.000
0.000 | 0.222
0.000 | 0.122
0.000 | 0.262
0.348 | 0.689
0.166 | 0.282
0.000 | 0.000
3peptides
spectra
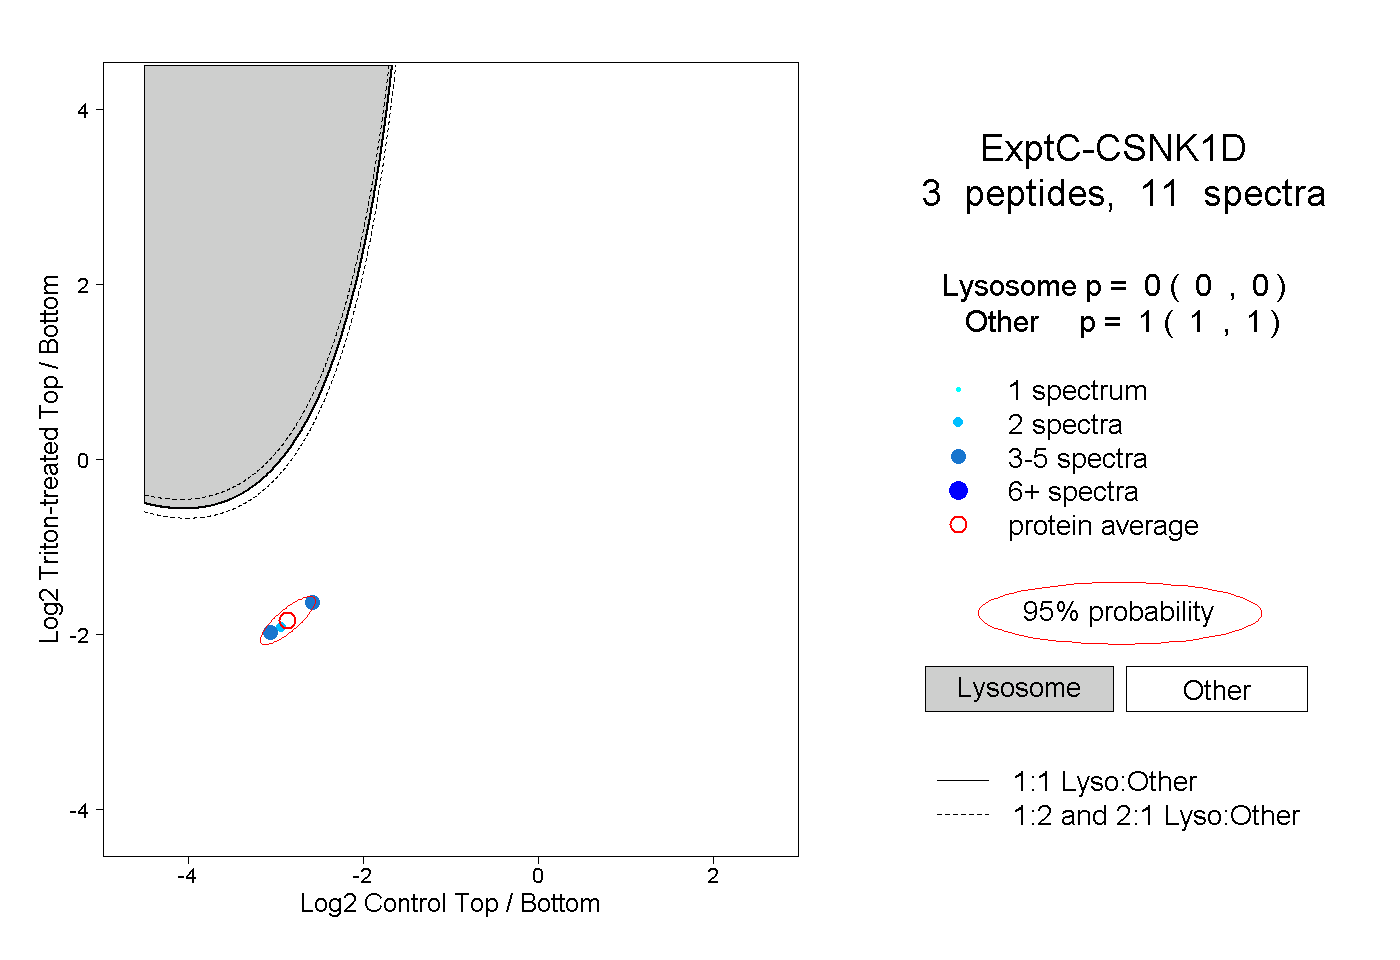
0.000 | 0.000
1.000 | 1.000
1peptide
spectrum
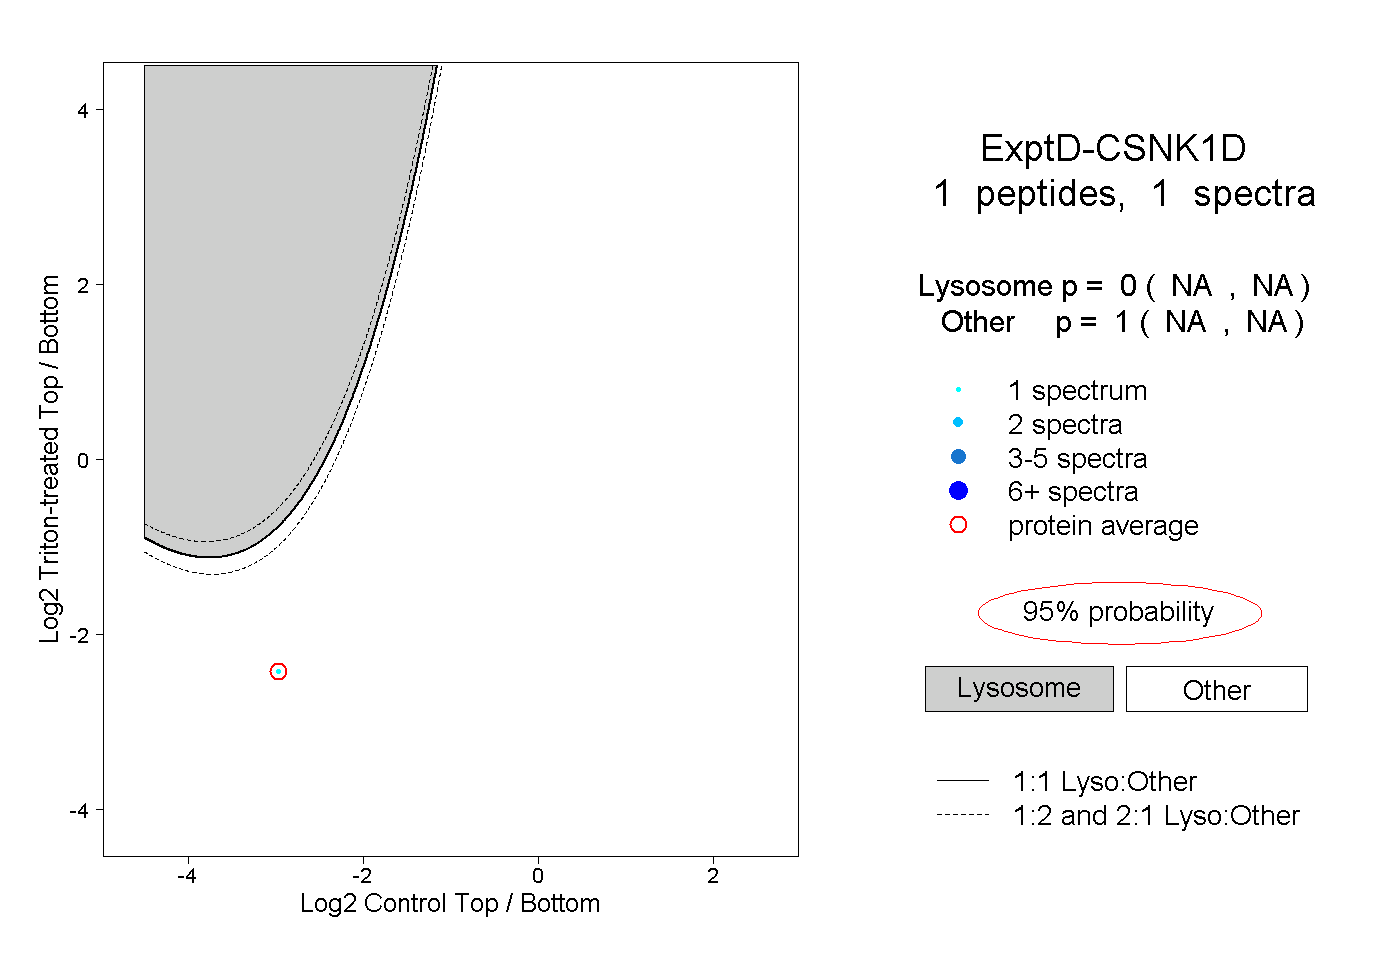
NA | NA
NA | NA