19
19peptides
spectra
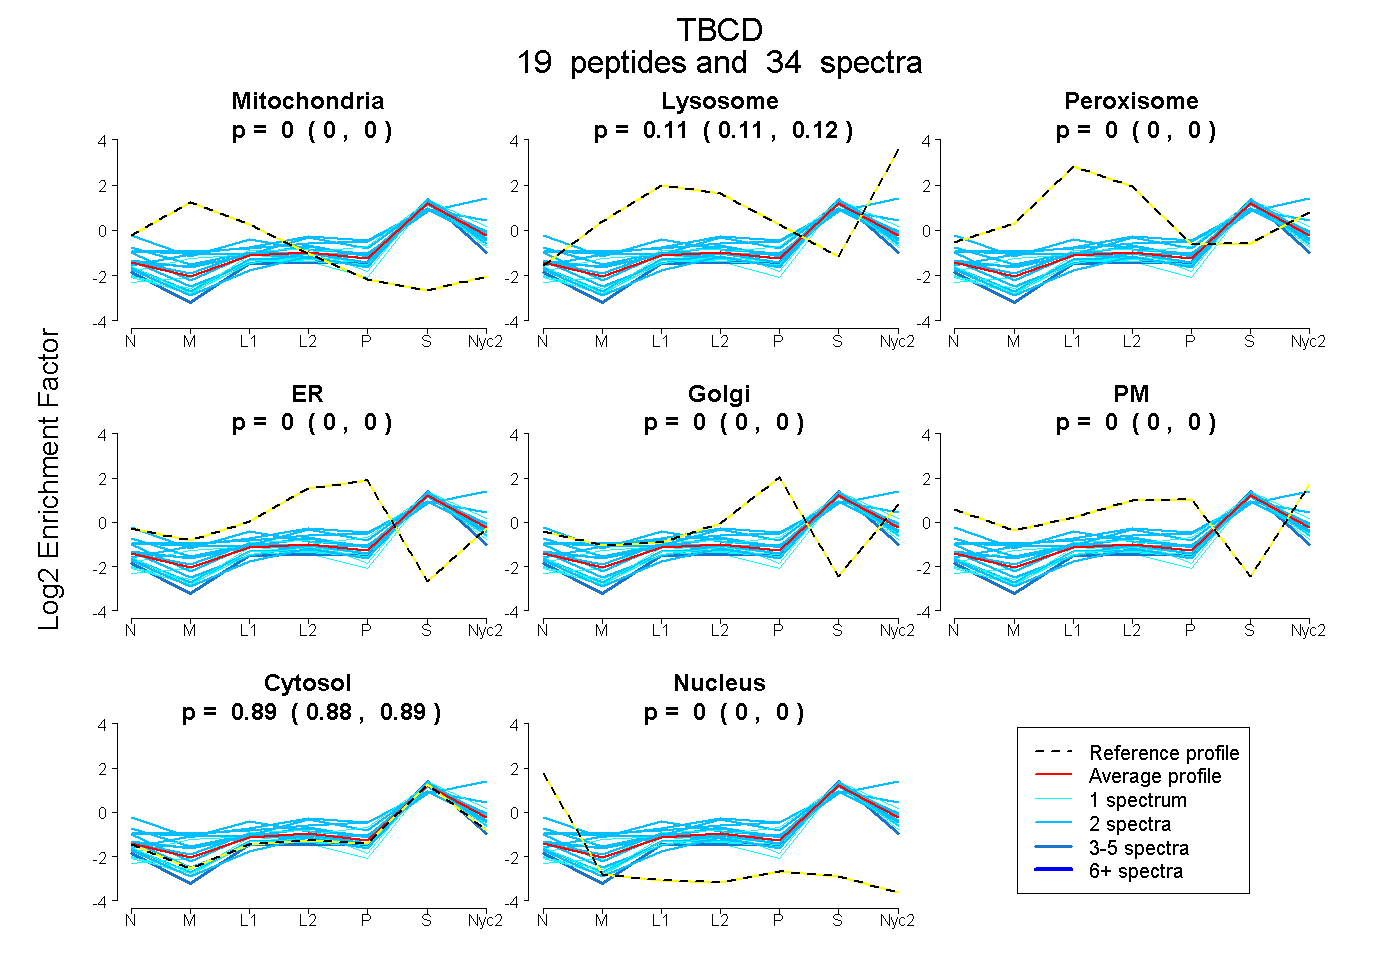
0.000 | 0.000
0.108 | 0.117
0.000 | 0.000
0.000 | 0.000
0.000 | 0.000
0.000 | 0.000
0.882 | 0.891
0.000 | 0.000
7peptides
spectra
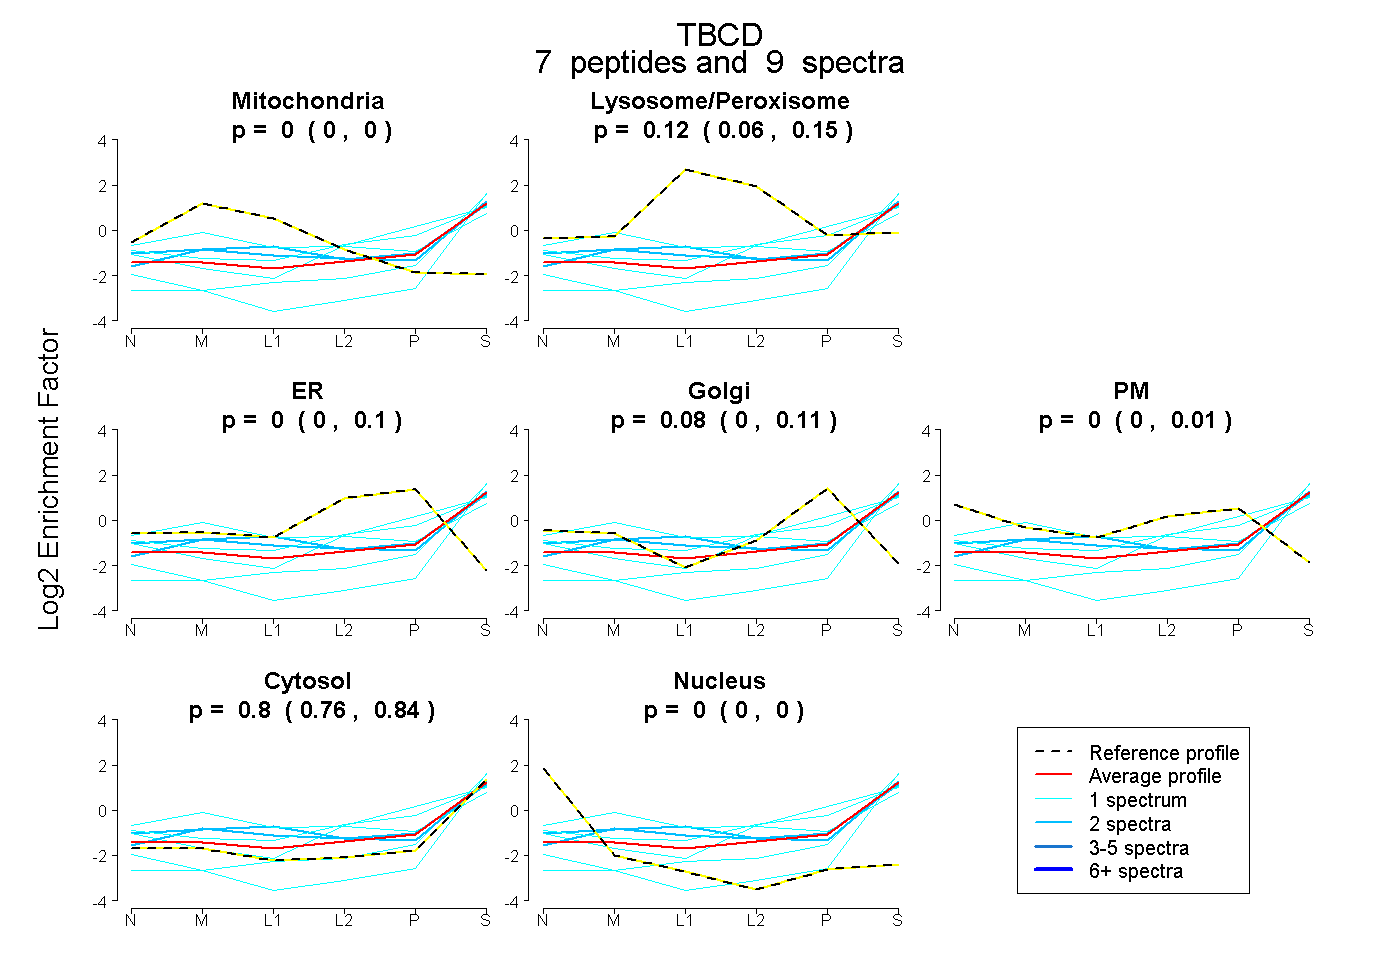
0.000 | 0.000
0.061 | 0.152
0.000 | 0.095
0.000 | 0.114
0.000 | 0.012
0.761 | 0.835
0.000 | 0.000