 19
19peptides
spectra
0.000 | 0.000
0.108 | 0.117
0.000 | 0.000
0.000 | 0.000
0.000 | 0.000
0.000 | 0.000
0.882 | 0.891
0.000 | 0.000
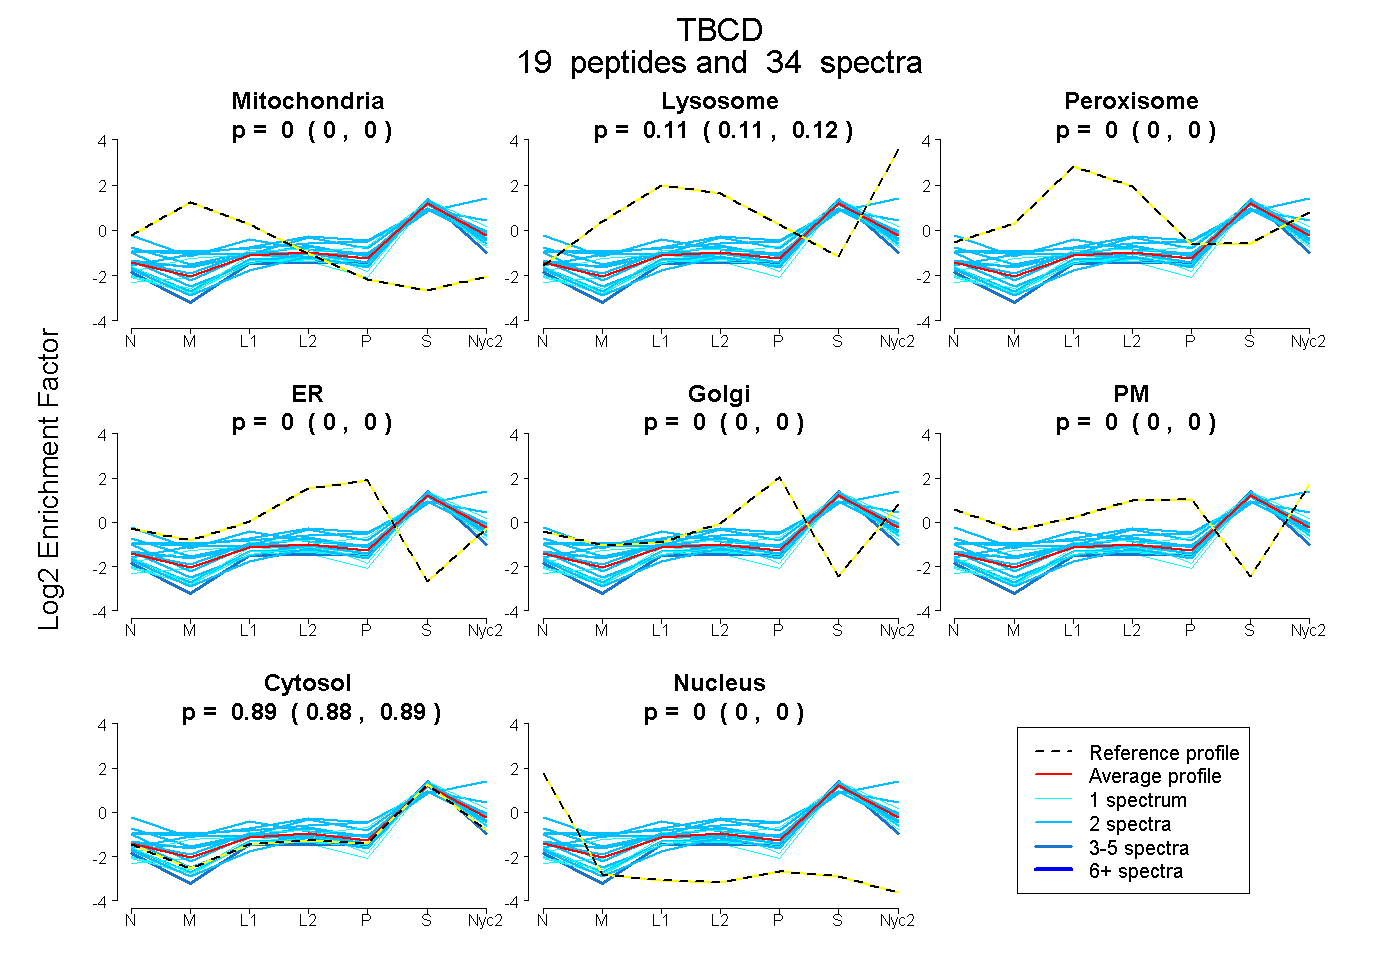
| Plot | Mito | Lyso | Perox | ER | Golgi | PM | Cytosol | Nucleus | |||||
| Expt A |
19 peptides |
34 spectra |
|
0.000 0.000 | 0.000 |
0.113 0.108 | 0.117 |
0.000 0.000 | 0.000 |
0.000 0.000 | 0.000 |
0.000 0.000 | 0.000 |
0.000 0.000 | 0.000 |
0.887 0.882 | 0.891 |
0.000 0.000 | 0.000 |
| 1 spectrum, LVTDYLDEK | 0.000 | 0.000 | 0.000 | 0.000 | 0.000 | 0.000 | 1.000 | 0.000 | ||
| 1 spectrum, GLGGELMR | 0.000 | 0.041 | 0.000 | 0.000 | 0.000 | 0.000 | 0.959 | 0.000 | ||
| 2 spectra, VTCTTSPMDVSFAEAR | 0.007 | 0.051 | 0.063 | 0.000 | 0.000 | 0.000 | 0.879 | 0.000 | ||
| 1 spectrum, LGLTFLKPK | 0.000 | 0.043 | 0.000 | 0.000 | 0.000 | 0.000 | 0.957 | 0.000 | ||
| 2 spectra, SPEEMTR | 0.000 | 0.093 | 0.022 | 0.000 | 0.000 | 0.080 | 0.805 | 0.000 | ||
| 2 spectra, GHLQQVLSGLR | 0.000 | 0.315 | 0.000 | 0.000 | 0.000 | 0.062 | 0.602 | 0.022 | ||
| 1 spectrum, LSEVVTVILK | 0.000 | 0.140 | 0.000 | 0.000 | 0.000 | 0.000 | 0.860 | 0.000 | ||
| 2 spectra, LDGNLPTQSGETR | 0.000 | 0.071 | 0.000 | 0.000 | 0.000 | 0.000 | 0.929 | 0.000 | ||
| 2 spectra, LLTLCK | 0.026 | 0.045 | 0.094 | 0.000 | 0.000 | 0.000 | 0.835 | 0.000 | ||
| 2 spectra, VFEDNLLNDR | 0.000 | 0.008 | 0.000 | 0.000 | 0.000 | 0.000 | 0.992 | 0.000 | ||
| 2 spectra, ALTYDEK | 0.000 | 0.156 | 0.000 | 0.000 | 0.000 | 0.075 | 0.758 | 0.012 | ||
| 2 spectra, DHETWETR | 0.000 | 0.000 | 0.228 | 0.000 | 0.124 | 0.000 | 0.648 | 0.000 | ||
| 4 spectra, GACSVGANVR | 0.000 | 0.000 | 0.000 | 0.000 | 0.000 | 0.000 | 1.000 | 0.000 | ||
| 2 spectra, ELESLFPR | 0.109 | 0.097 | 0.000 | 0.000 | 0.000 | 0.000 | 0.794 | 0.000 | ||
| 1 spectrum, VSVSLLK | 0.000 | 0.019 | 0.000 | 0.044 | 0.013 | 0.000 | 0.924 | 0.000 | ||
| 2 spectra, QIHQQLCDR | 0.035 | 0.005 | 0.177 | 0.000 | 0.125 | 0.000 | 0.659 | 0.000 | ||
| 1 spectrum, FLYIITK | 0.142 | 0.018 | 0.000 | 0.000 | 0.000 | 0.000 | 0.839 | 0.000 | ||
| 2 spectra, ASTLEAFGESAETR | 0.000 | 0.018 | 0.000 | 0.000 | 0.000 | 0.000 | 0.982 | 0.000 | ||
| 2 spectra, INHWDGAIR | 0.005 | 0.130 | 0.032 | 0.000 | 0.000 | 0.000 | 0.833 | 0.000 |
| Plot | Mito | Lyso or Perox | ER | Golgi | PM | Cytosol | Nucleus | ||||||
| Expt B |
7 peptides |
9 spectra |
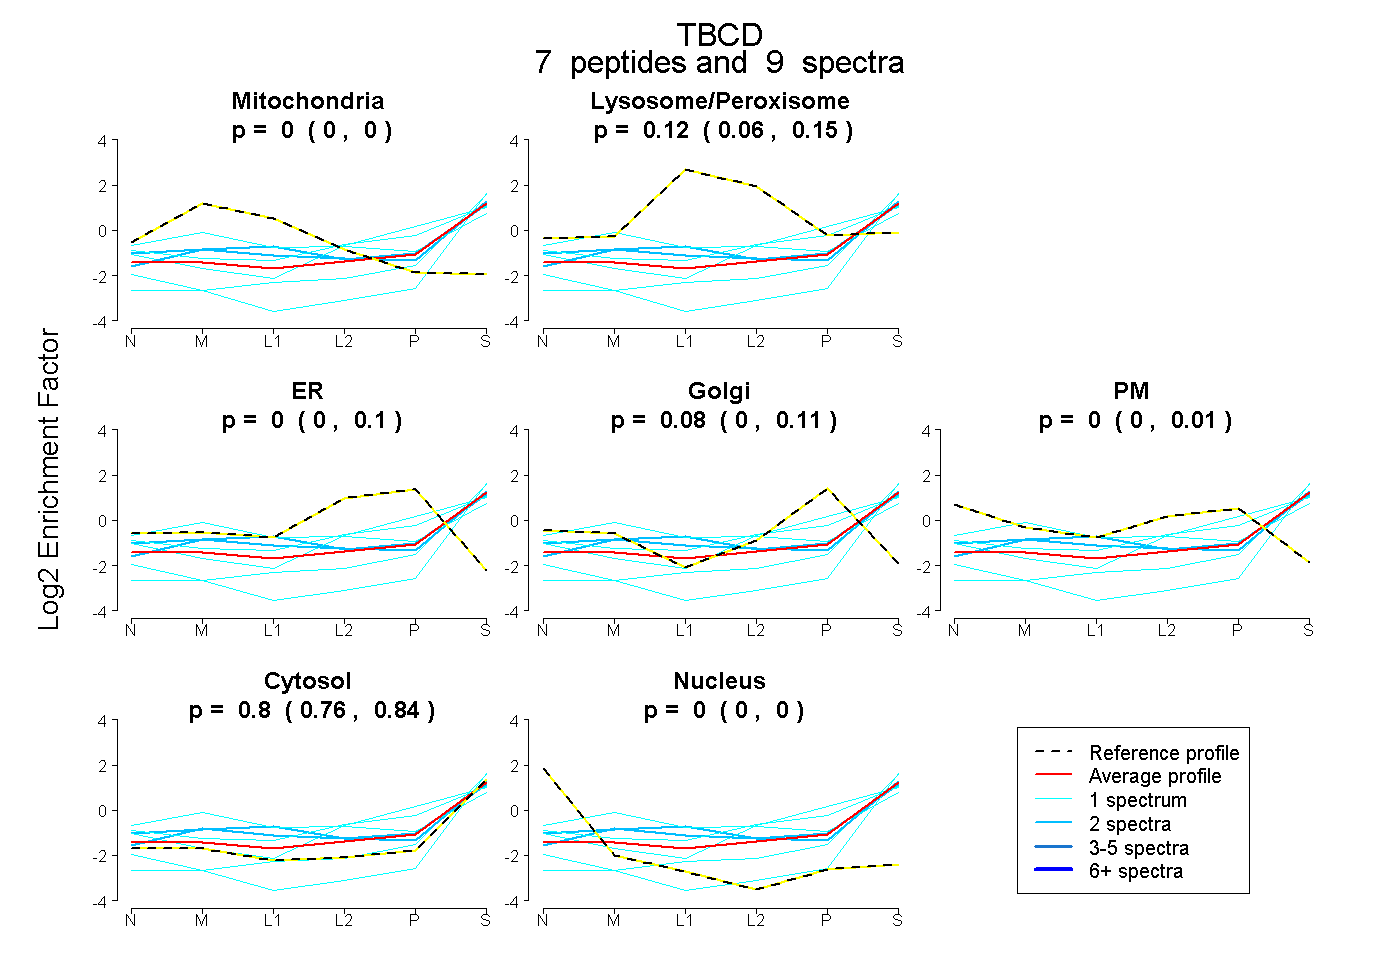 |
0.000 0.000 | 0.000 |
0.122 0.061 | 0.152 |
0.000 0.000 | 0.095 |
0.082 0.000 | 0.114 |
0.000 0.000 | 0.012 |
0.796 0.761 | 0.835 |
0.000 0.000 | 0.000 |
|||
| Plot | Lyso | Other | |||||||||||
| Expt C |
9 peptides |
18 spectra |
 |
0.000 0.000 | 0.000 |
1.000 1.000 | 1.000 |
||||||||
| Plot | Lyso | Other | |||||||||||
| Expt D |
1 peptide |
1 spectrum |
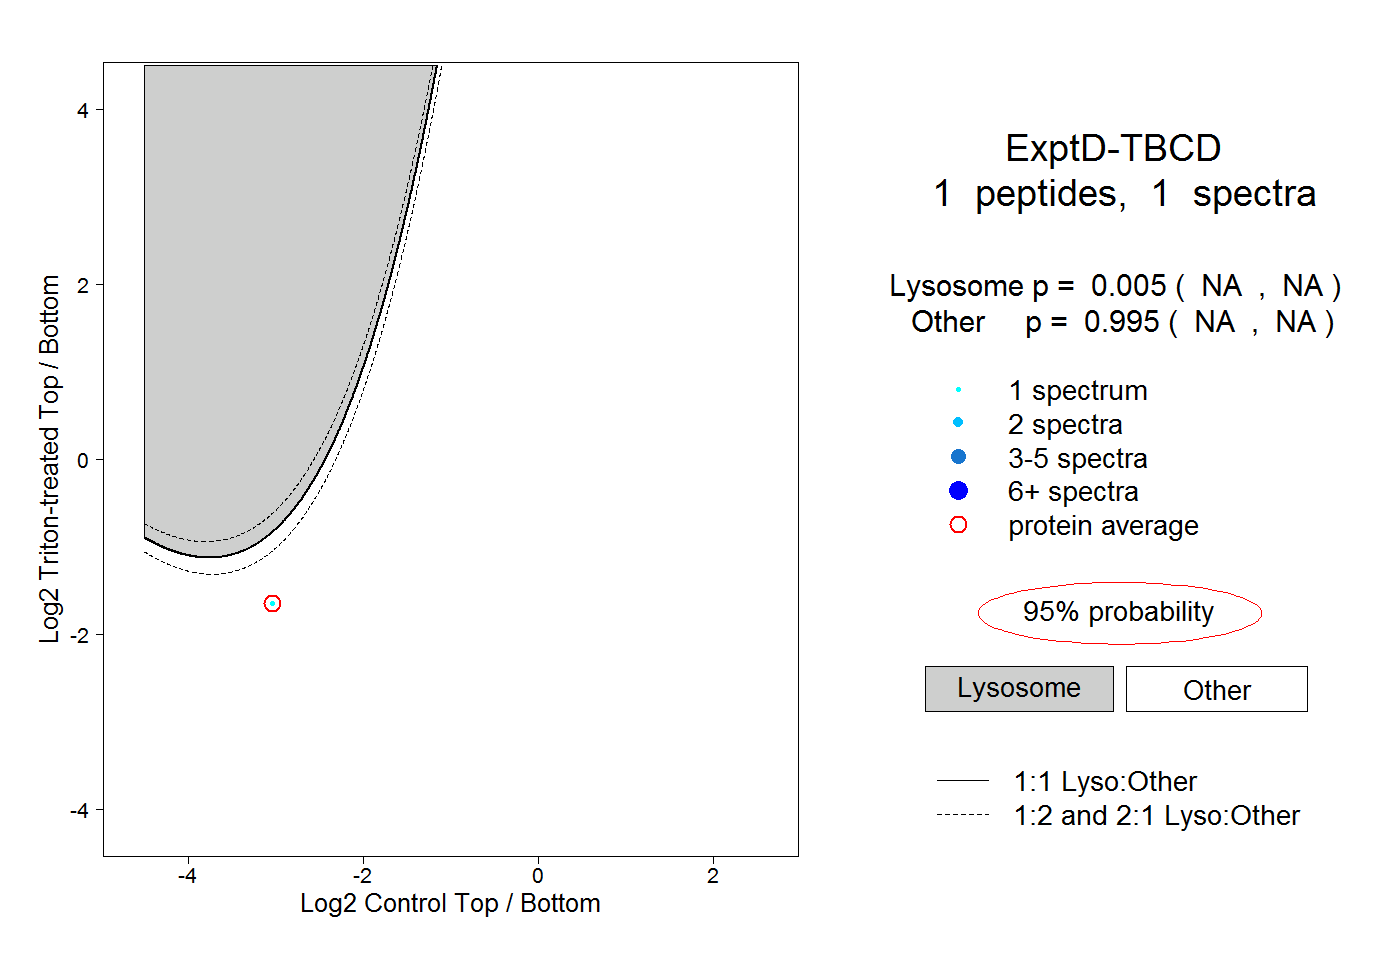 |
0.005 NA | NA |
0.995 NA | NA |