8
8peptides
spectra
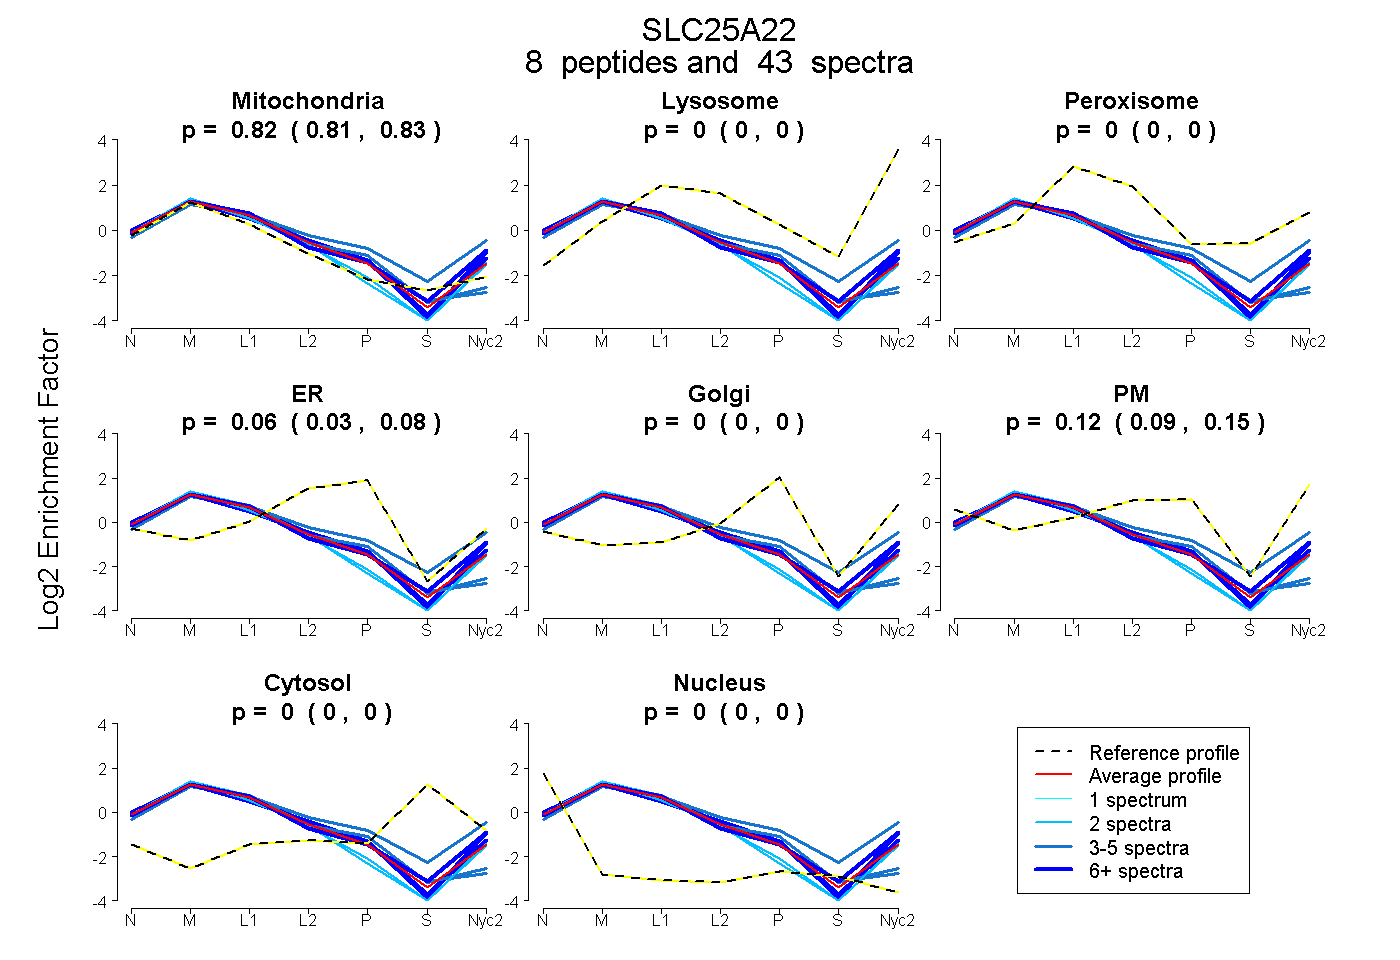
0.813 | 0.831
0.000 | 0.002
0.000 | 0.000
0.030 | 0.077
0.000 | 0.000
0.091 | 0.146
0.000 | 0.000
0.000 | 0.000
6peptides
spectra
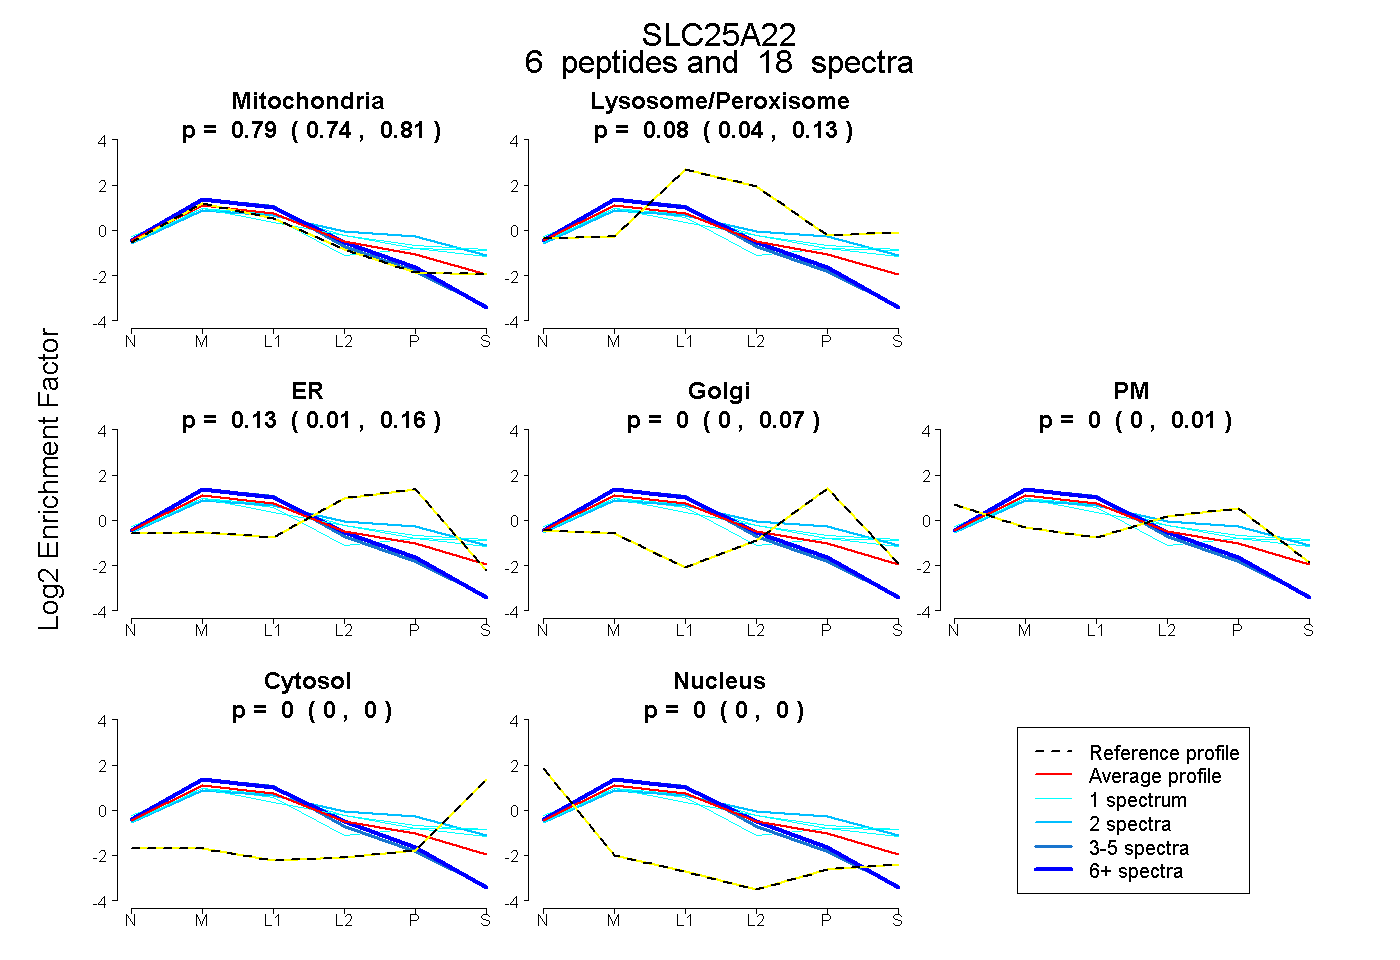
0.741 | 0.812
0.044 | 0.134
0.013 | 0.159
0.000 | 0.067
0.000 | 0.008
0.000 | 0.000
0.000 | 0.000