 8
8peptides
spectra
0.813 | 0.831
0.000 | 0.002
0.000 | 0.000
0.030 | 0.077
0.000 | 0.000
0.091 | 0.146
0.000 | 0.000
0.000 | 0.000
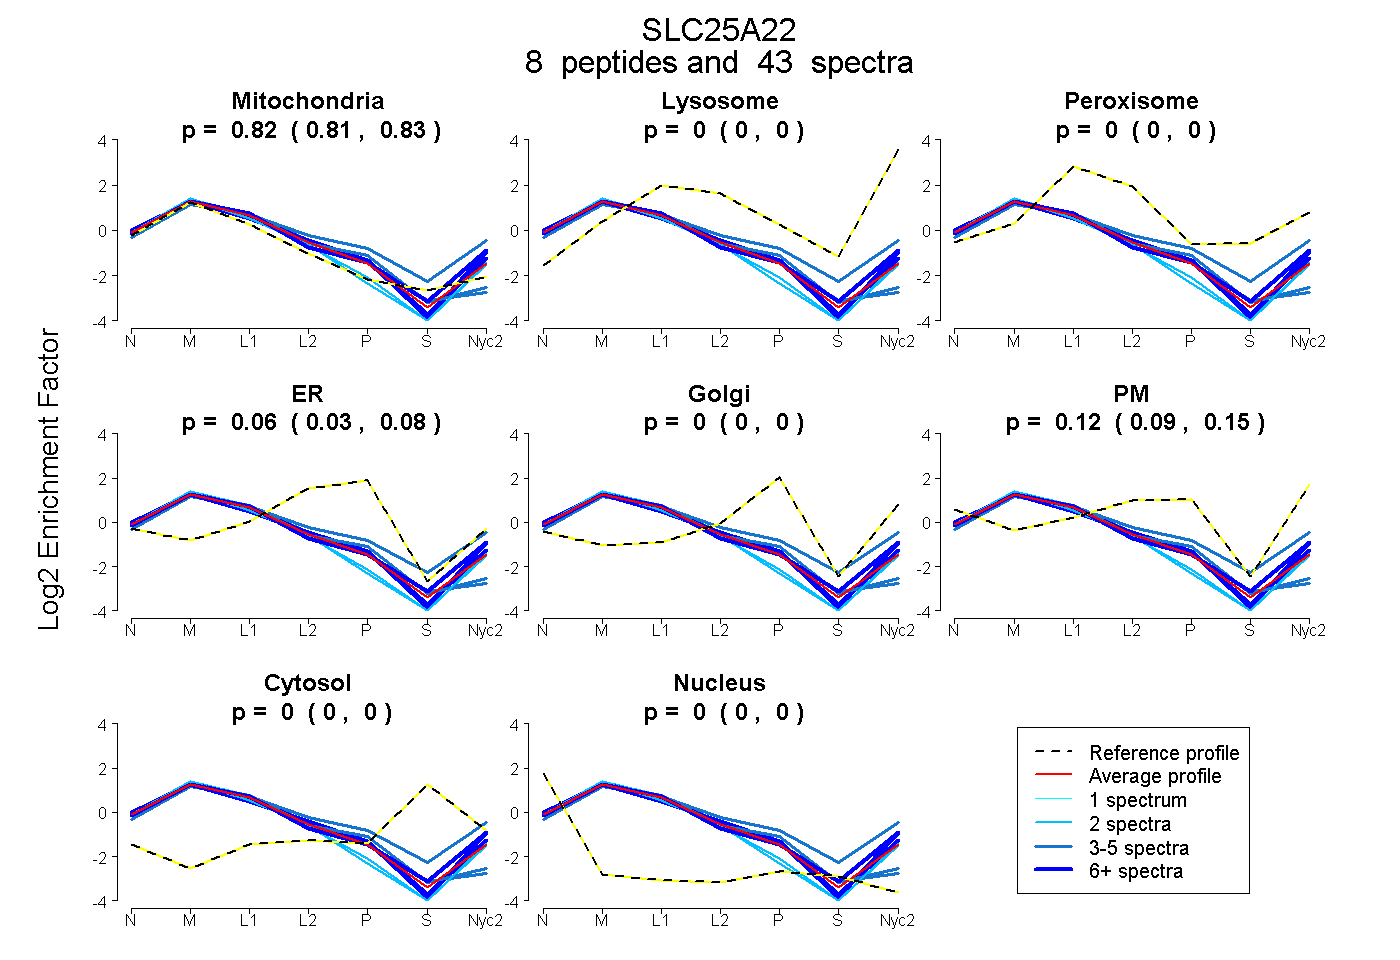
| Plot | Mito | Lyso | Perox | ER | Golgi | PM | Cytosol | Nucleus | |||||
| Expt A |
8 peptides |
43 spectra |
|
0.823 0.813 | 0.831 |
0.000 0.000 | 0.002 |
0.000 0.000 | 0.000 |
0.056 0.030 | 0.077 |
0.000 0.000 | 0.000 |
0.120 0.091 | 0.146 |
0.000 0.000 | 0.000 |
0.000 0.000 | 0.000 |
| 3 spectra, HEGPSAFLK | 0.627 | 0.194 | 0.013 | 0.060 | 0.003 | 0.103 | 0.000 | 0.000 | ||
| 4 spectra, GVNEDTYSGFLDCAR | 0.898 | 0.000 | 0.000 | 0.102 | 0.000 | 0.000 | 0.000 | 0.000 | ||
| 7 spectra, IQLQDAGR | 0.796 | 0.000 | 0.000 | 0.019 | 0.000 | 0.185 | 0.000 | 0.000 | ||
| 10 spectra, SEGYFGMYR | 0.779 | 0.073 | 0.000 | 0.000 | 0.000 | 0.148 | 0.000 | 0.000 | ||
| 2 spectra, GAAVNLTLVTPEK | 0.917 | 0.000 | 0.000 | 0.000 | 0.000 | 0.083 | 0.000 | 0.000 | ||
| 4 spectra, MYASMSDCLIK | 0.853 | 0.000 | 0.000 | 0.147 | 0.000 | 0.000 | 0.000 | 0.000 | ||
| 11 spectra, LAANDFFR | 0.747 | 0.000 | 0.000 | 0.000 | 0.000 | 0.253 | 0.000 | 0.000 | ||
| 2 spectra, QISLPAK | 0.928 | 0.000 | 0.000 | 0.000 | 0.000 | 0.072 | 0.000 | 0.000 |
| Plot | Mito | Lyso or Perox | ER | Golgi | PM | Cytosol | Nucleus | ||||||
| Expt B |
6 peptides |
18 spectra |
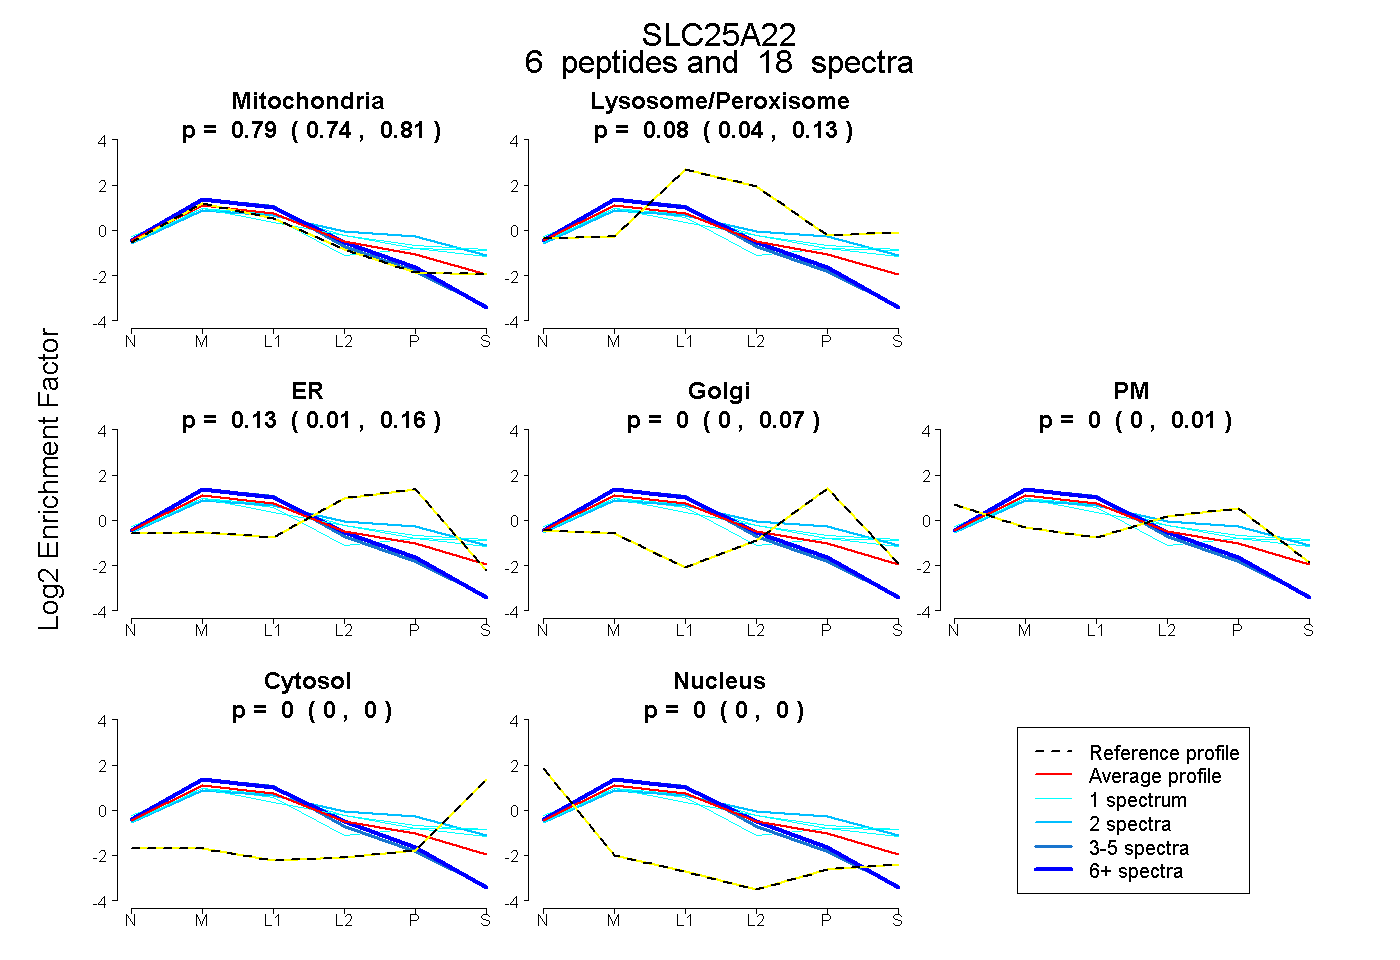 |
0.788 0.741 | 0.812 |
0.080 0.044 | 0.134 |
0.132 0.013 | 0.159 |
0.000 0.000 | 0.067 |
0.000 0.000 | 0.008 |
0.000 0.000 | 0.000 |
0.000 0.000 | 0.000 |
|||
| Plot | Lyso | Other | |||||||||||
| Expt C |
9 peptides |
214 spectra |
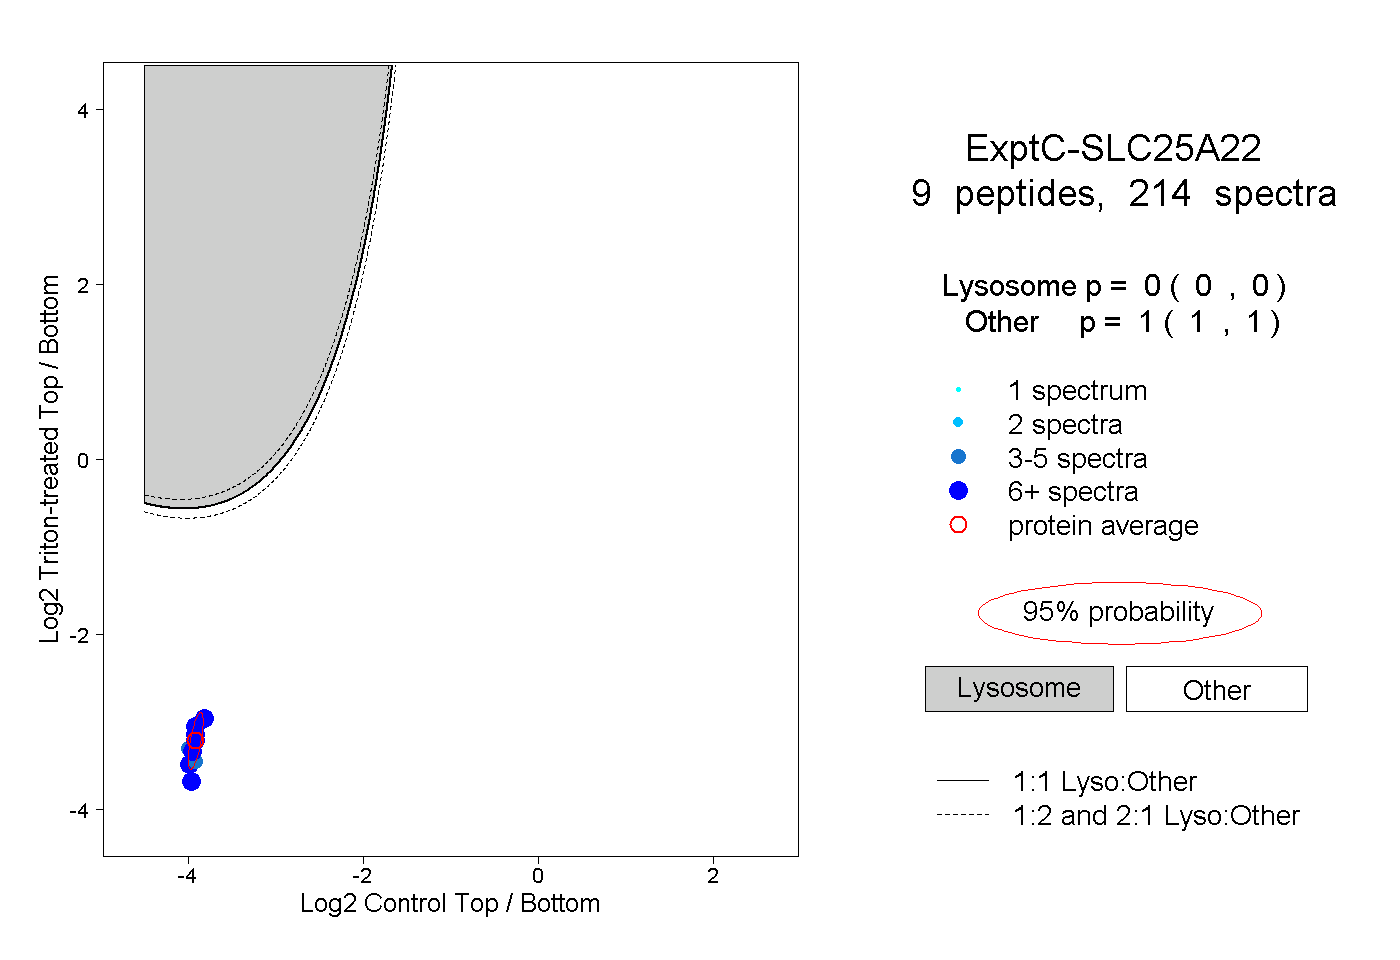 |
0.000 0.000 | 0.000 |
1.000 1.000 | 1.000 |
||||||||
| Plot | Lyso | Other | |||||||||||
| Expt D |
6 peptides |
13 spectra |
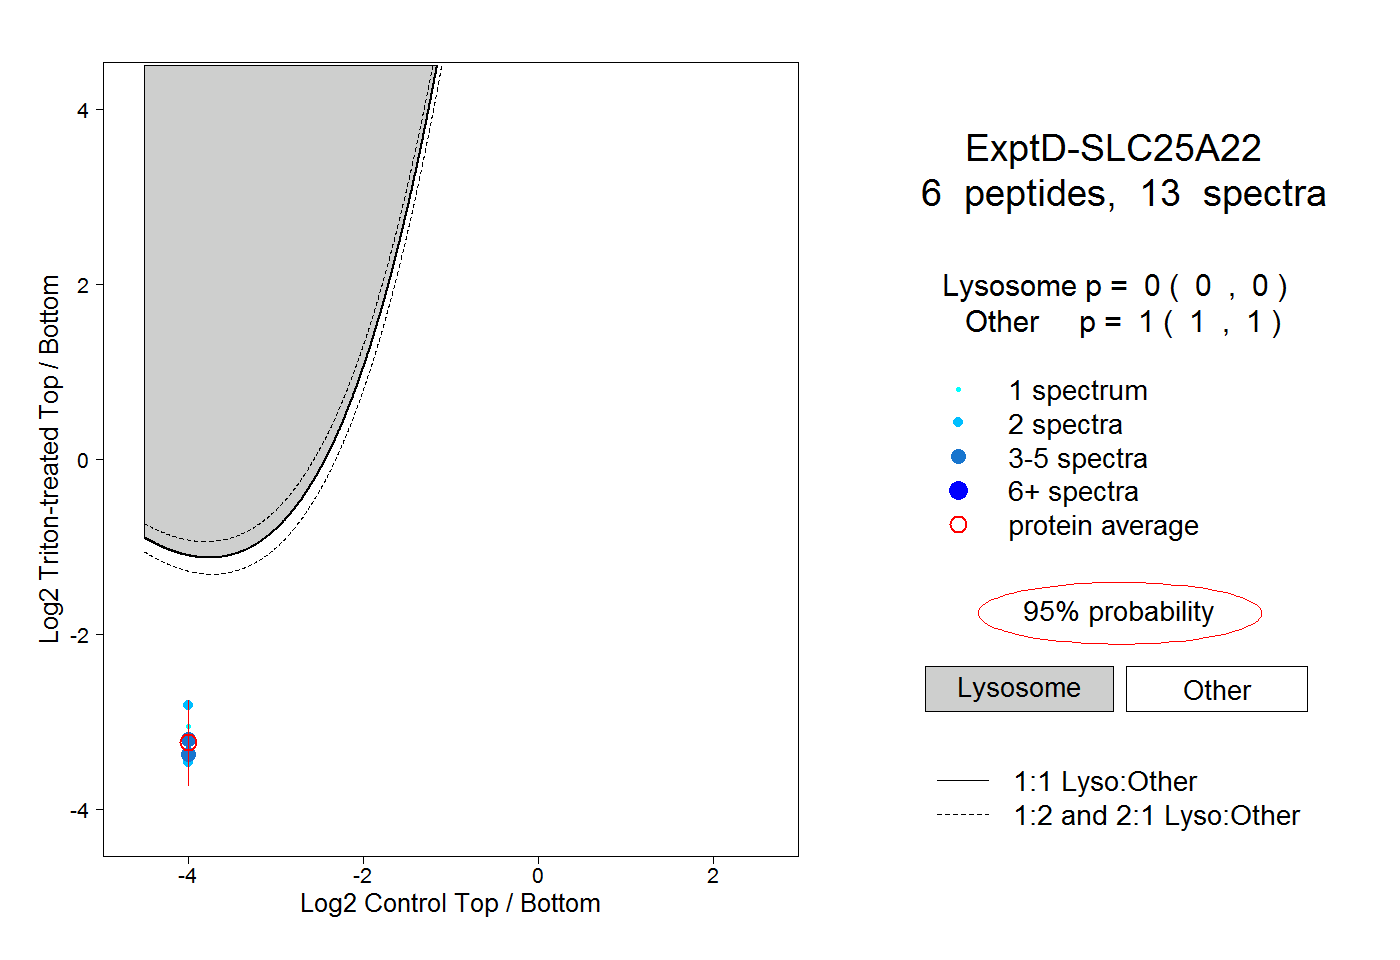 |
0.000 0.000 | 0.000 |
1.000 1.000 | 1.000 |