 3
3peptides
spectra
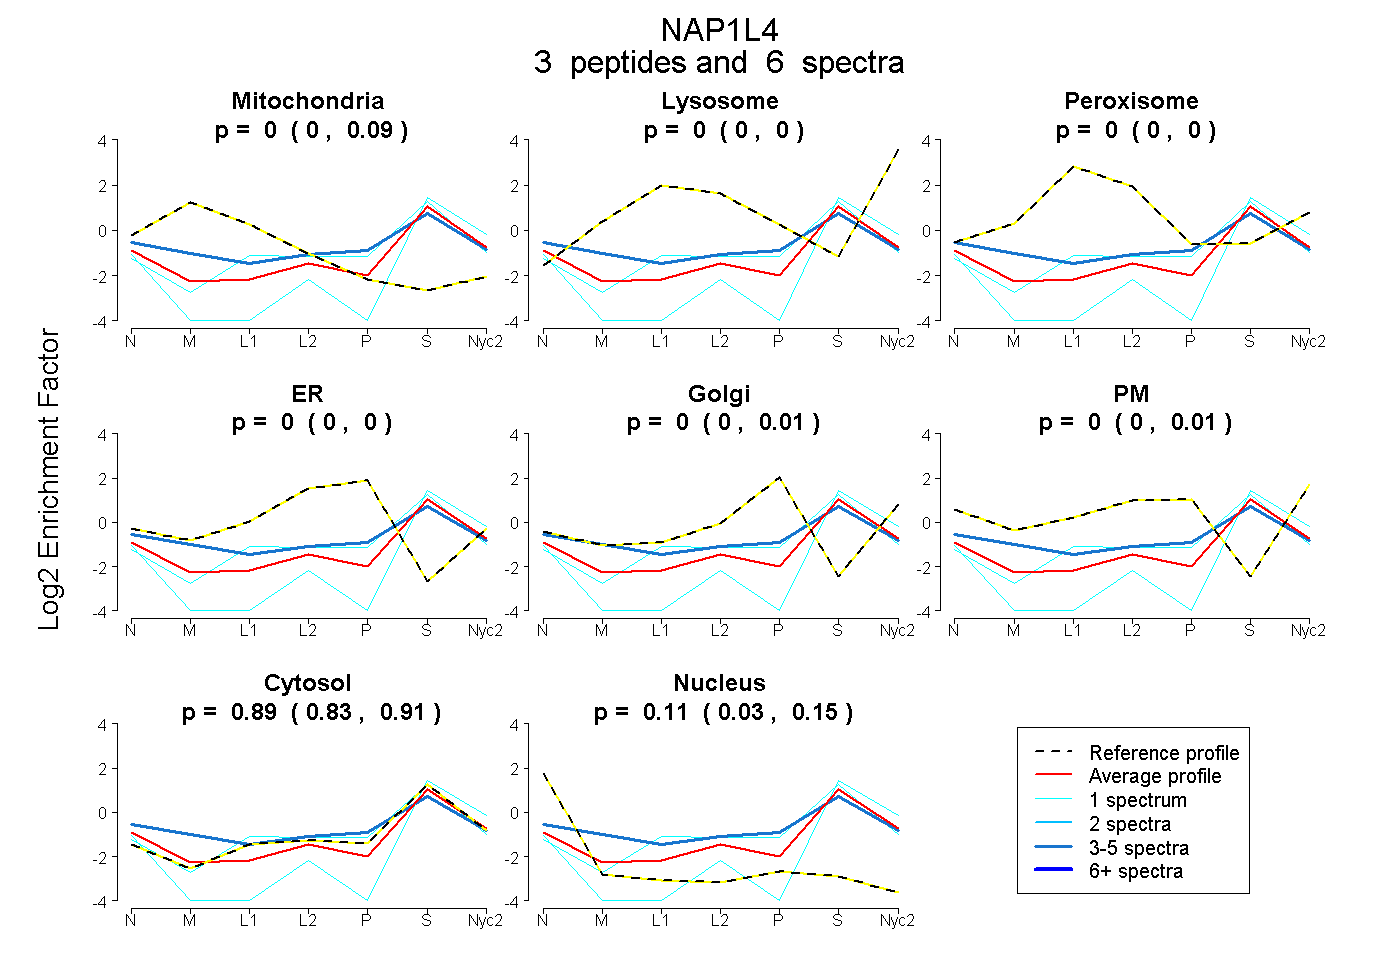
0.000 | 0.091
0.000 | 0.002
0.000 | 0.000
0.000 | 0.000
0.000 | 0.010
0.000 | 0.008
0.828 | 0.915
0.032 | 0.145
2peptides
spectra
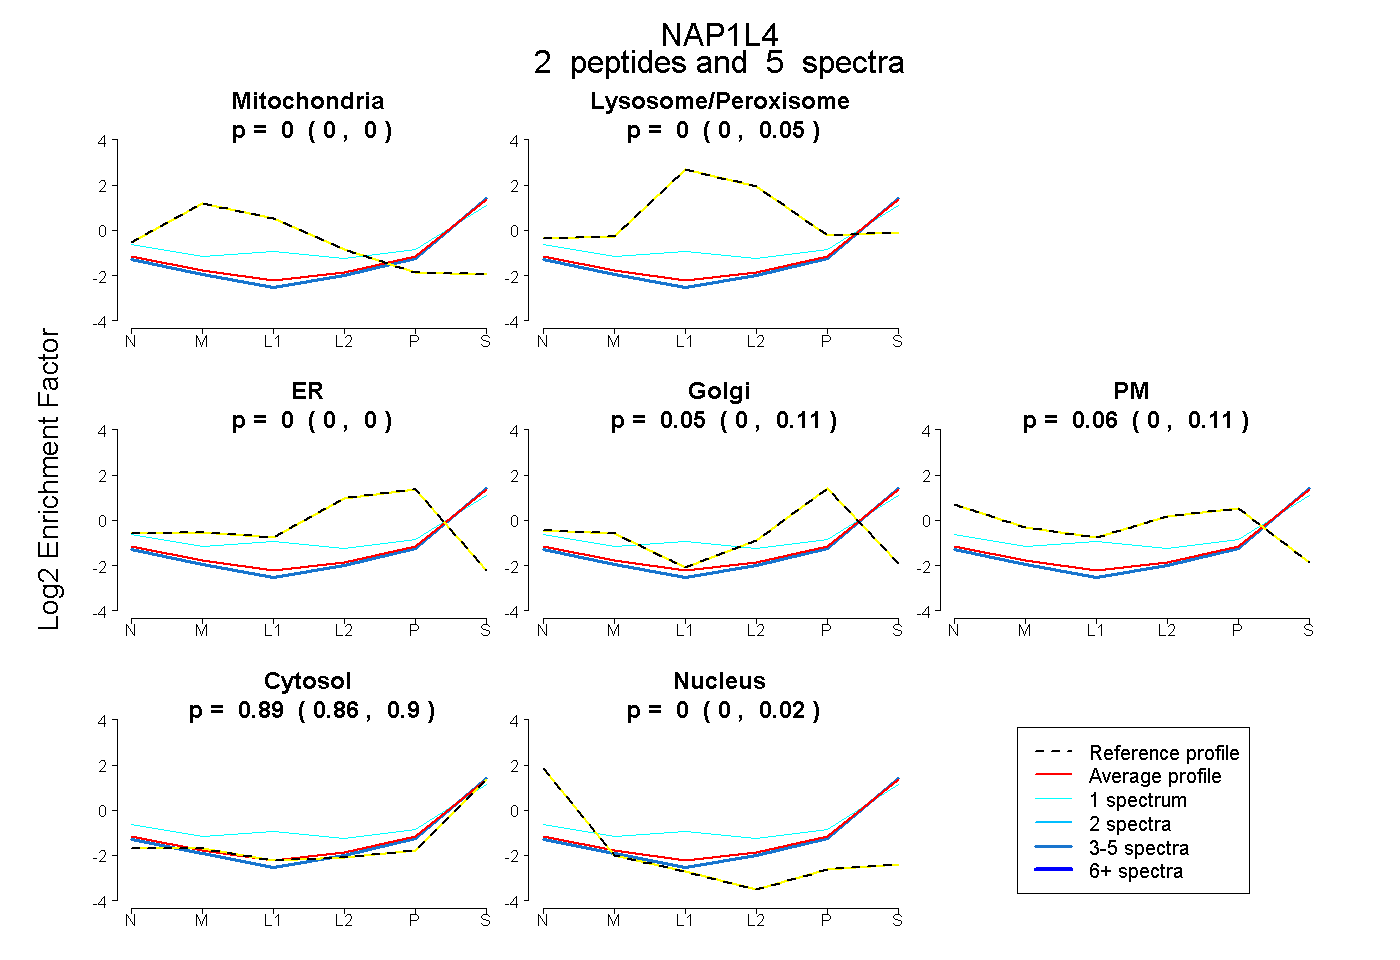
0.000 | 0.000
0.000 | 0.048
0.000 | 0.000
0.000 | 0.113
0.000 | 0.110
0.861 | 0.899
0.000 | 0.015
8peptides
spectra
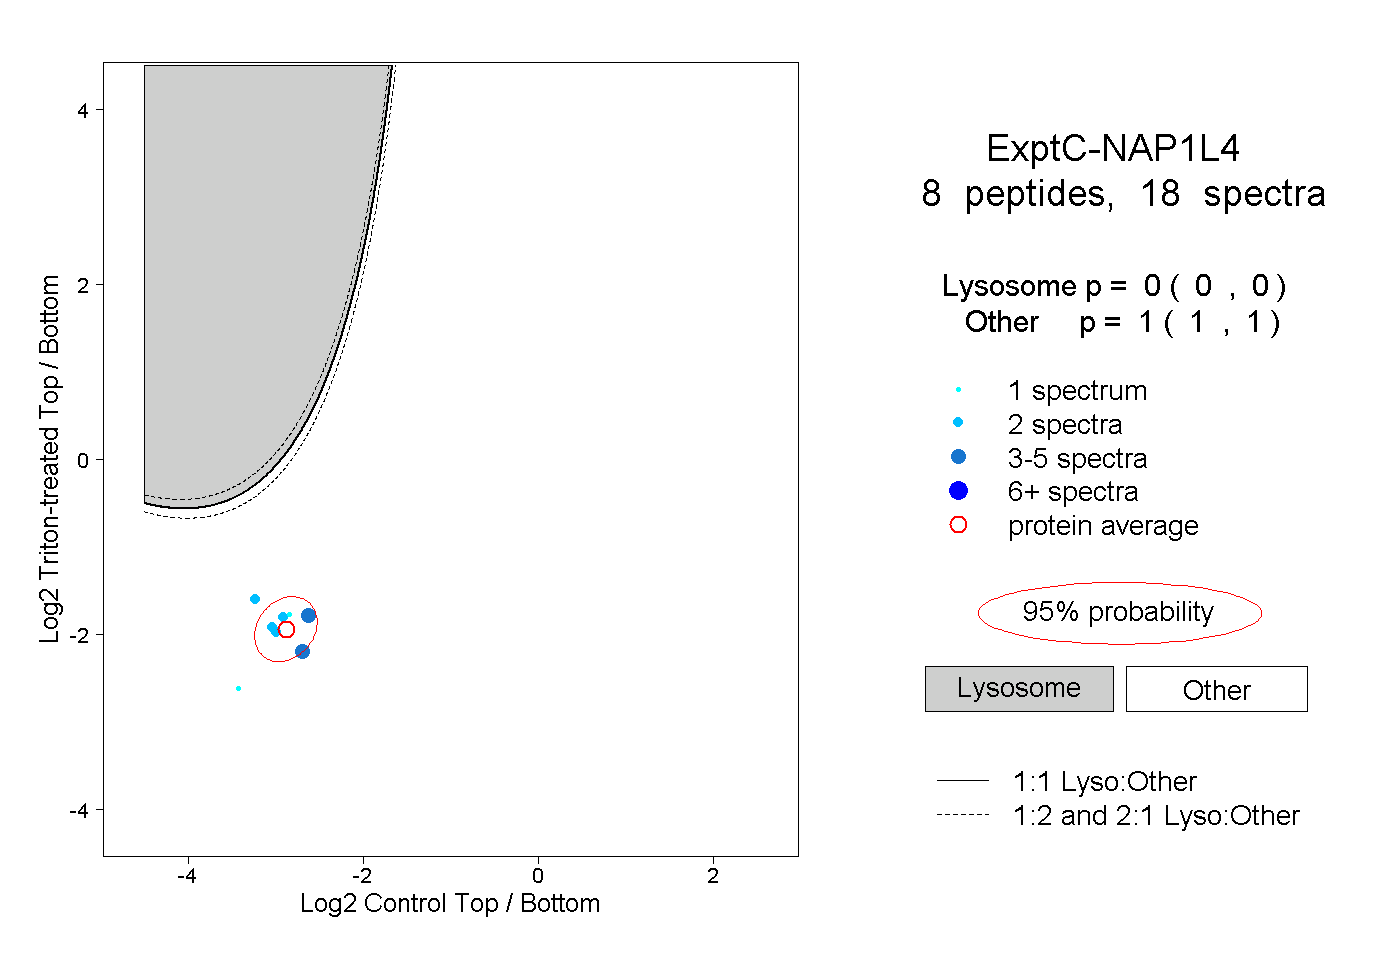
0.000 | 0.000
1.000 | 1.000