 5
5peptides
spectra
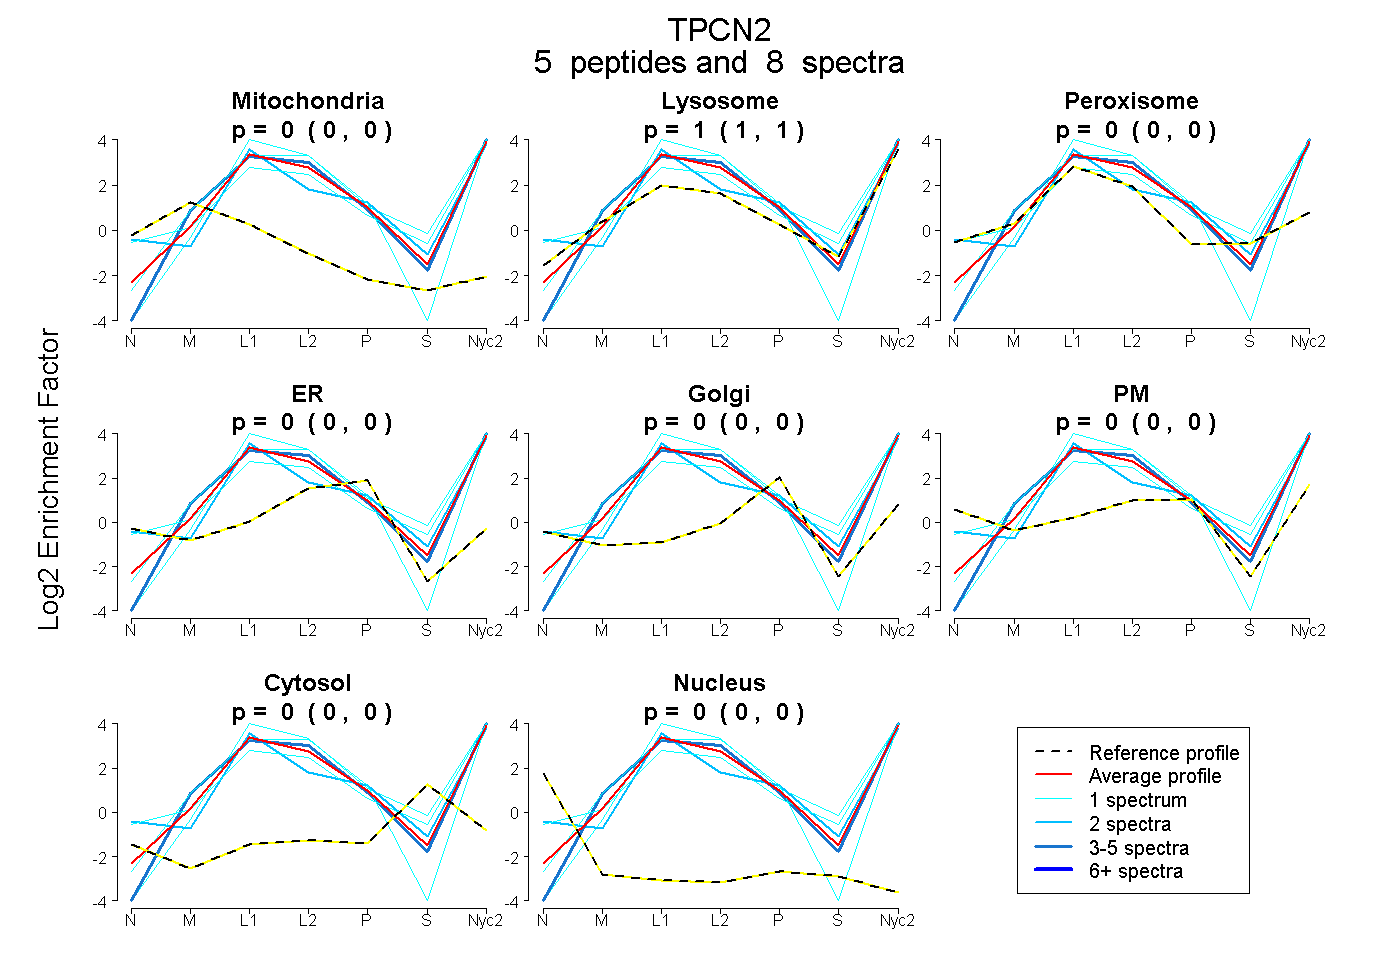
0.000 | 0.000
1.000 | 1.000
0.000 | 0.000
0.000 | 0.000
0.000 | 0.000
0.000 | 0.000
0.000 | 0.000
0.000 | 0.000
8peptides
spectra
1.000 | 1.000
0.000 | 0.000
| Plot | Mito | Lyso | Perox | ER | Golgi | PM | Cytosol | Nucleus | |||||
| Expt A |
5 peptides |
8 spectra |
|
0.000 0.000 | 0.000 |
1.000 1.000 | 1.000 |
0.000 0.000 | 0.000 |
0.000 0.000 | 0.000 |
0.000 0.000 | 0.000 |
0.000 0.000 | 0.000 |
0.000 0.000 | 0.000 |
0.000 0.000 | 0.000 |
||
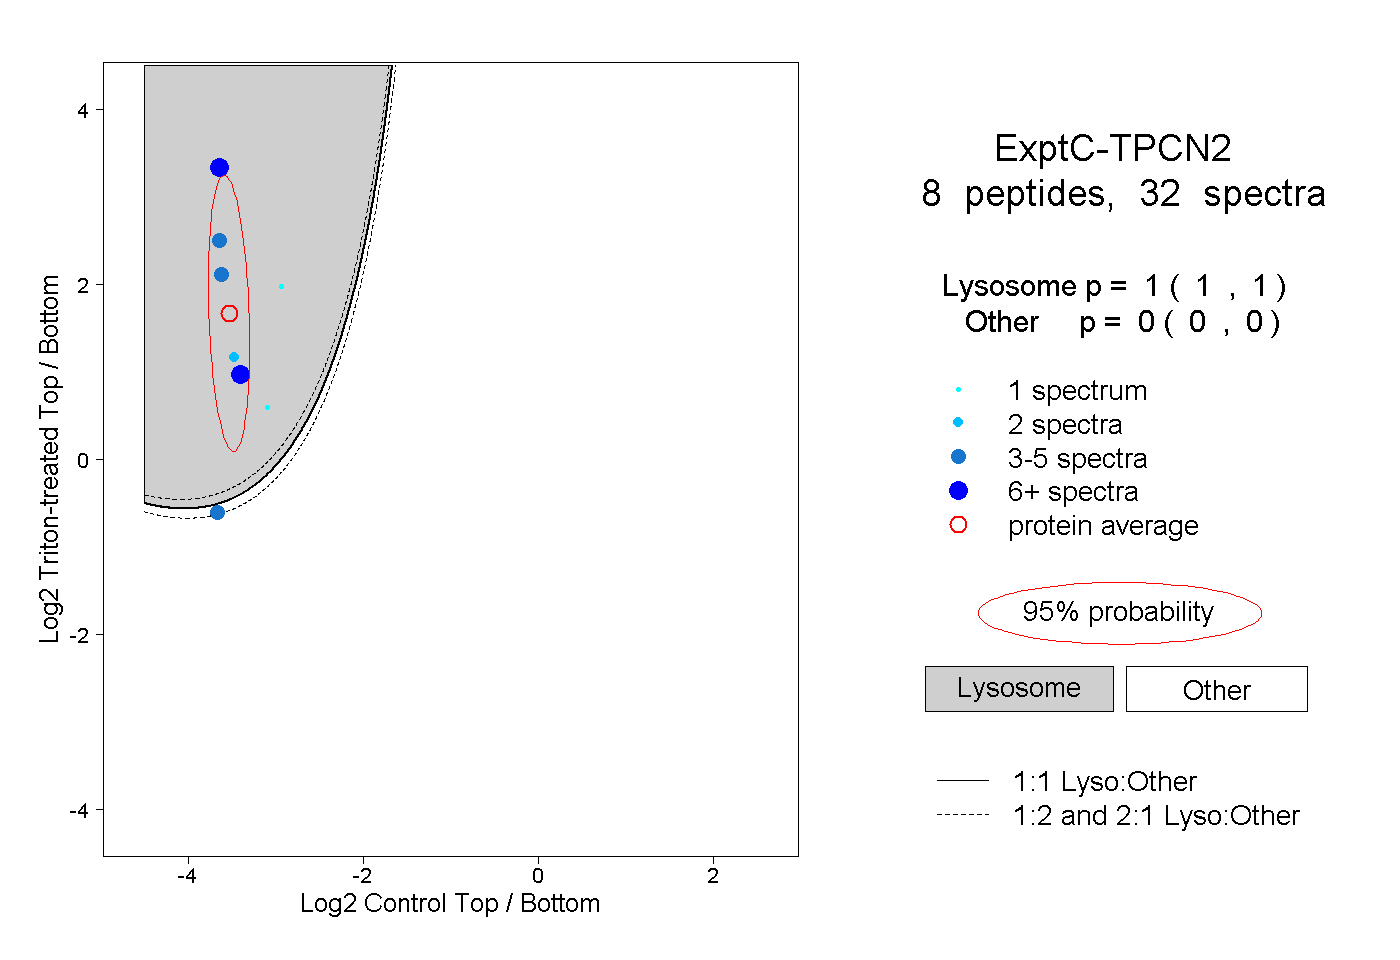
| Plot | Lyso | Other | |||||||||||
| Expt C |
8 peptides |
32 spectra |
|
1.000 1.000 | 1.000 |
0.000 0.000 | 0.000 |
| 1 spectrum, VHSYEGRPILADEFQK | 0.999 | 0.001 | ||||||||
| 8 spectra, SLQTSLFR | 1.000 | 0.000 | ||||||||
| 2 spectra, QLLVGTK | 1.000 | 0.000 | ||||||||
| 1 spectrum, DEAQNK | 1.000 | 0.000 | ||||||||
| 4 spectra, WDPQGHK | 0.254 | 0.746 | ||||||||
| 5 spectra, LDAGSLWLYR | 1.000 | 0.000 | ||||||||
| 6 spectra, LFDEVDK | 1.000 | 0.000 | ||||||||
| 5 spectra, QAIIQK | 1.000 | 0.000 |
| Plot | Lyso | Other | |||||||||||
| Expt D |
3 peptides |
6 spectra |
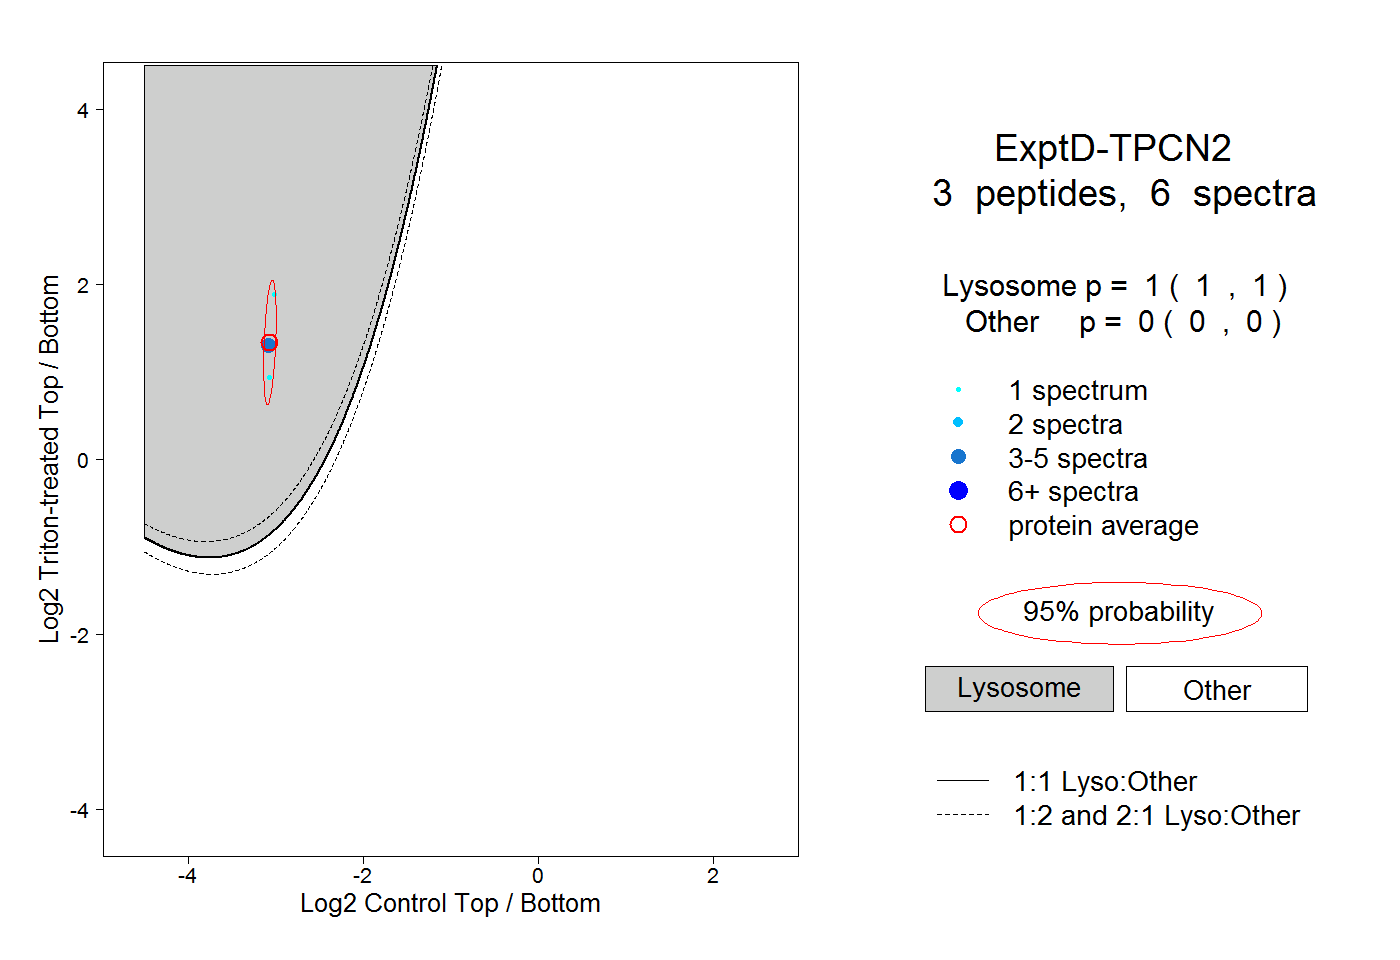 |
1.000 1.000 | 1.000 |
0.000 0.000 | 0.000 |