 5
5peptides
spectra
0.000 | 0.000
0.000 | 0.000
0.000 | 0.000
0.000 | 0.285
0.000 | 0.373
0.000 | 0.000
0.090 | 0.200
0.453 | 0.568
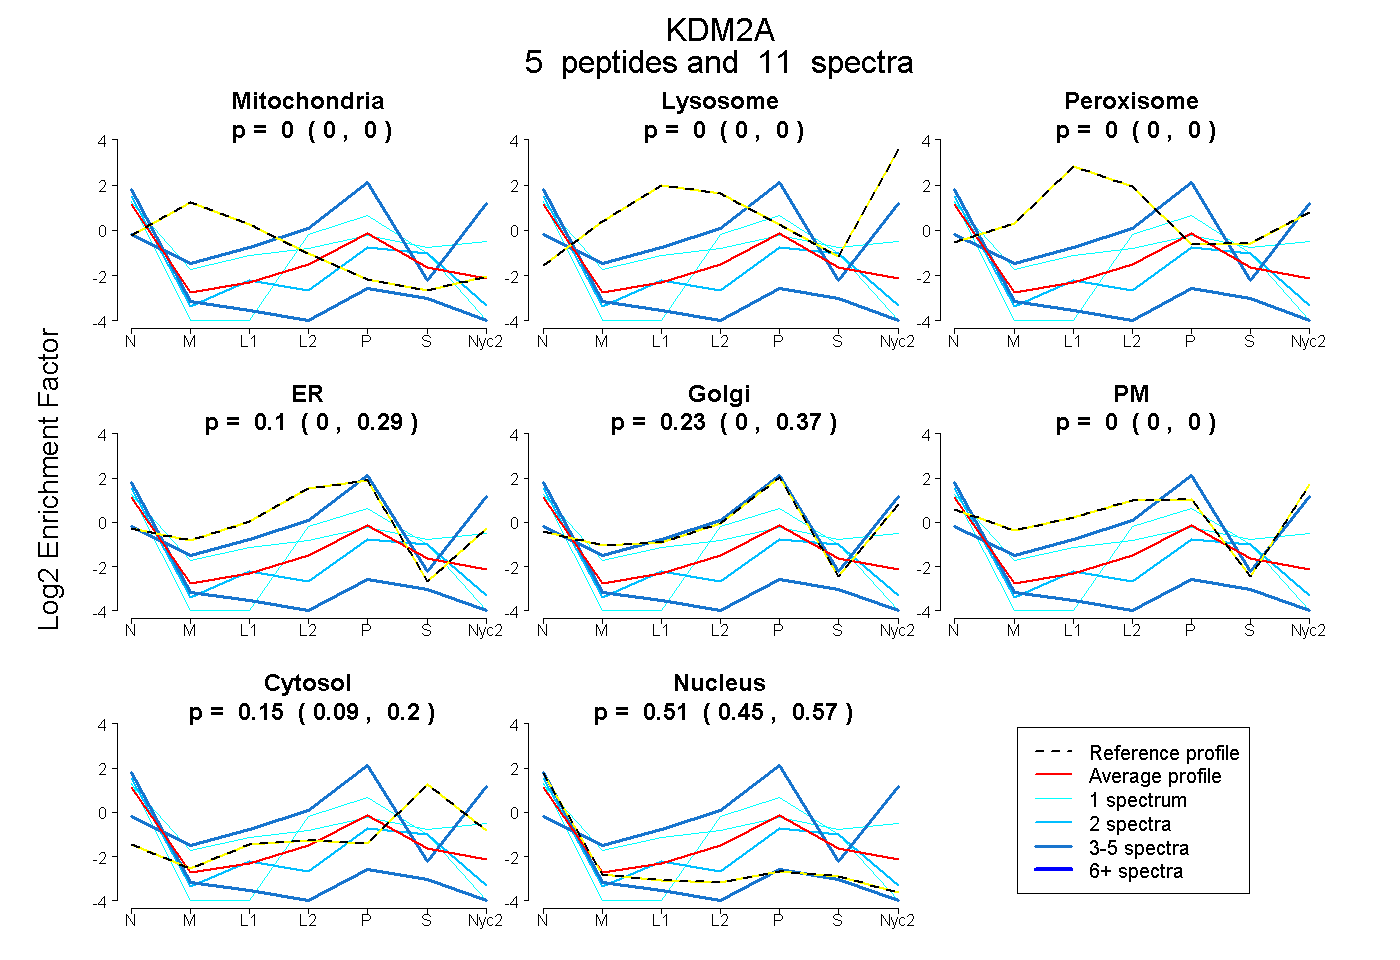
| Plot | Mito | Lyso | Perox | ER | Golgi | PM | Cytosol | Nucleus | |||||
| Expt A |
5 peptides |
11 spectra |
|
0.000 0.000 | 0.000 |
0.000 0.000 | 0.000 |
0.000 0.000 | 0.000 |
0.102 0.000 | 0.285 |
0.232 0.000 | 0.373 |
0.000 0.000 | 0.000 |
0.151 0.090 | 0.200 |
0.515 0.453 | 0.568 |
| 4 spectra, LTPVRPAAASPIVSGAR | 0.000 | 0.000 | 0.000 | 0.000 | 0.000 | 0.000 | 0.000 | 1.000 | ||
| 3 spectra, TFDIEEK | 0.000 | 0.010 | 0.000 | 0.000 | 0.917 | 0.067 | 0.005 | 0.000 | ||
| 2 spectra, LQAITASSANLRPNPR | 0.000 | 0.000 | 0.000 | 0.061 | 0.000 | 0.000 | 0.275 | 0.664 | ||
| 1 spectrum, DLLTPPTDKPGQDNR | 0.000 | 0.000 | 0.000 | 0.000 | 0.000 | 0.443 | 0.301 | 0.256 | ||
| 1 spectrum, ILLEELASSDPK | 0.000 | 0.000 | 0.000 | 0.248 | 0.000 | 0.000 | 0.163 | 0.589 |
| Plot | Mito | Lyso or Perox | ER | Golgi | PM | Cytosol | Nucleus | ||||||
| Expt B |
1 peptide |
1 spectrum |
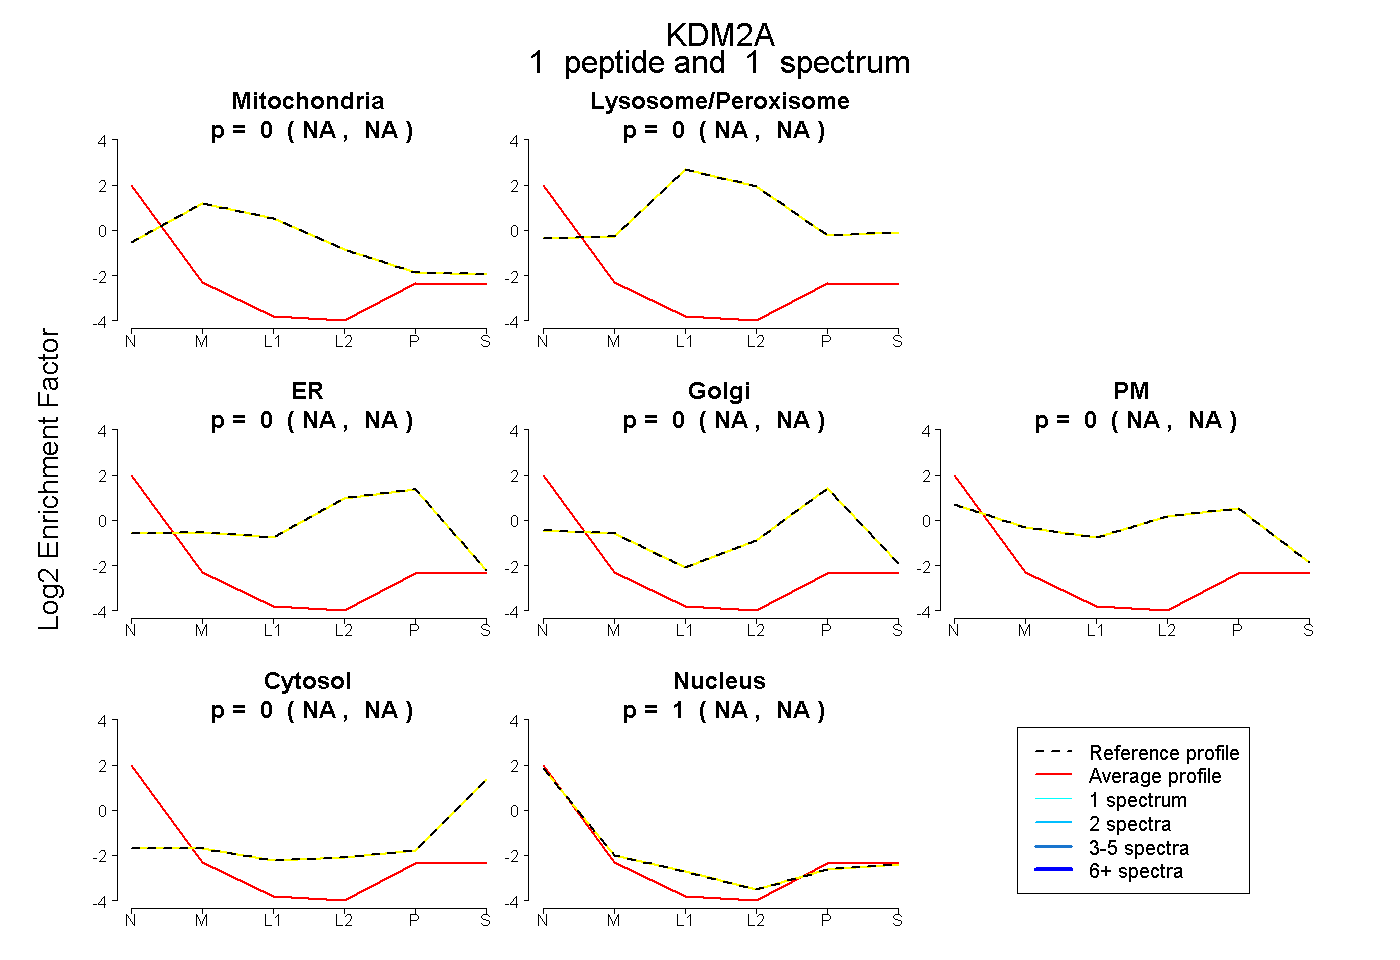 |
0.000 NA | NA |
0.000 NA | NA |
0.000 NA | NA |
0.000 NA | NA |
0.000 NA | NA |
0.000 NA | NA |
1.000 NA | NA |