23
23peptides
spectra
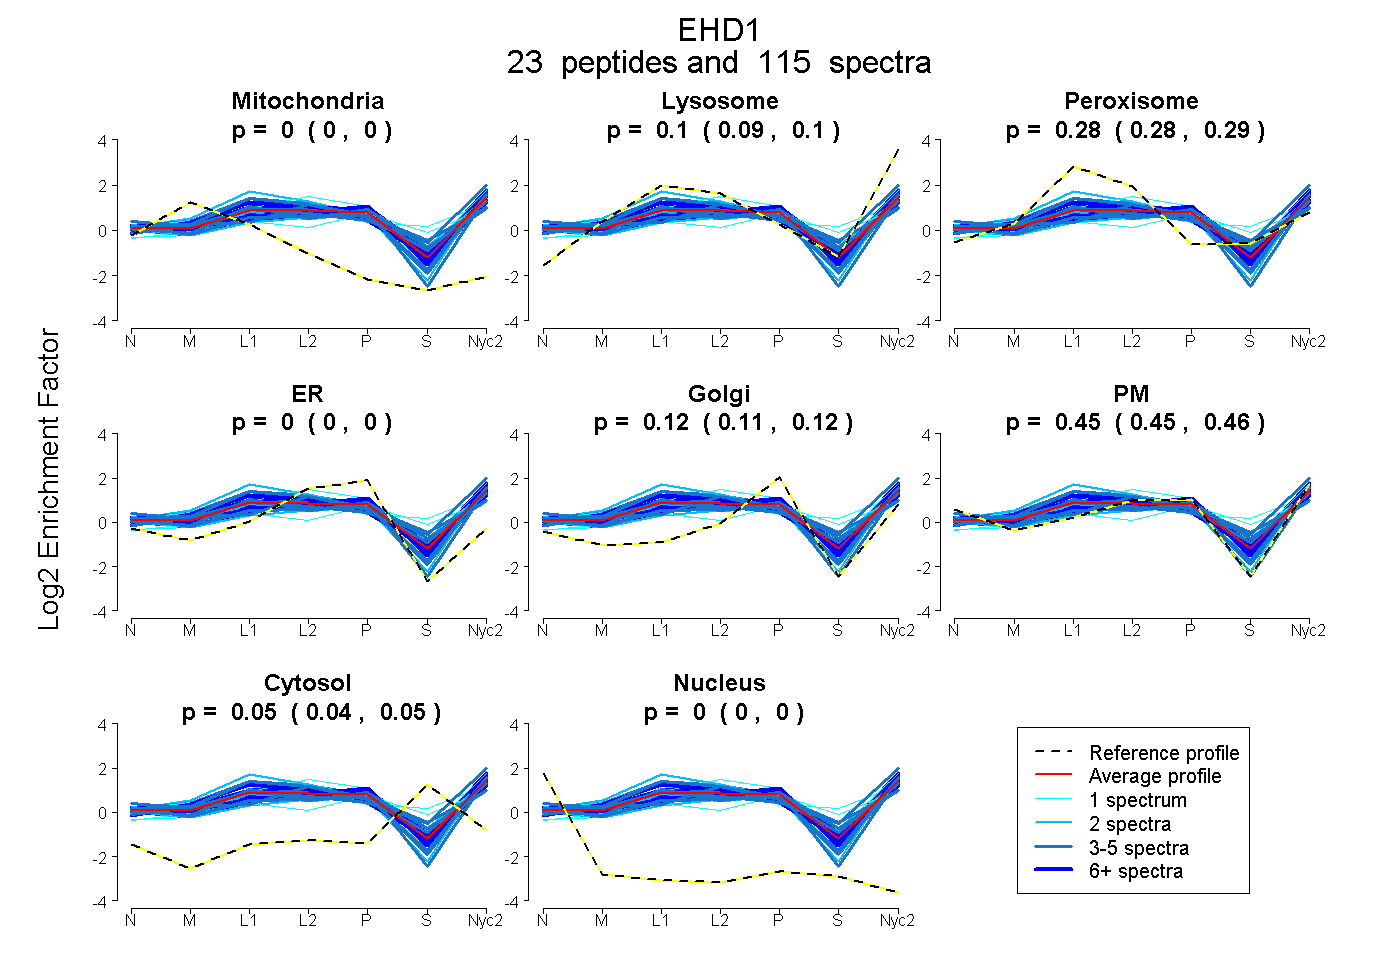
0.000 | 0.000
0.094 | 0.101
0.279 | 0.289
0.000 | 0.000
0.111 | 0.122
0.447 | 0.459
0.044 | 0.049
0.000 | 0.000
13peptides
spectra
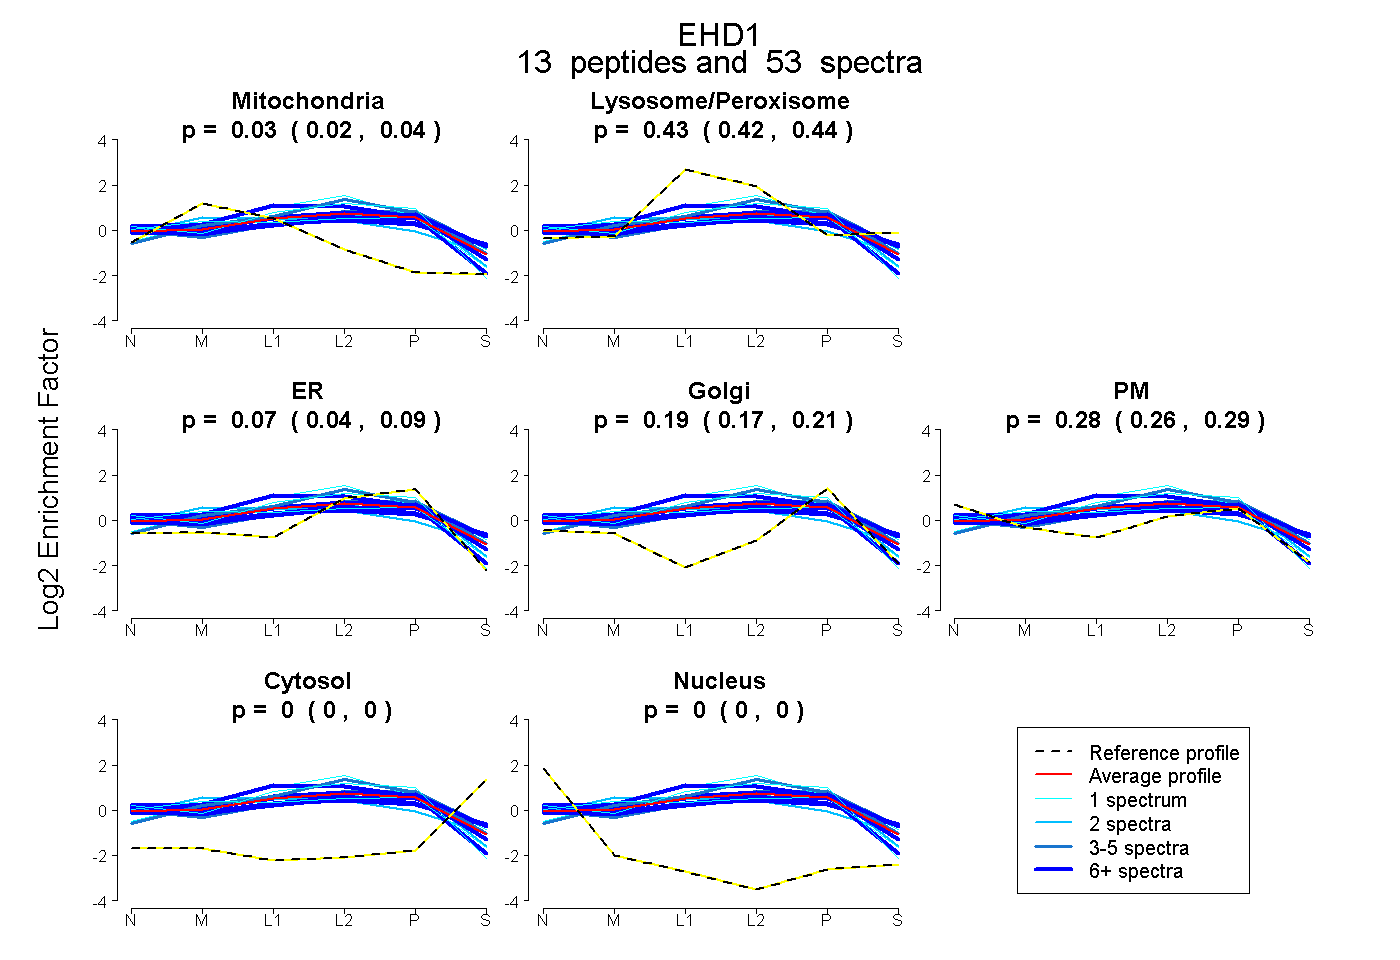
0.022 | 0.036
0.419 | 0.443
0.043 | 0.089
0.172 | 0.212
0.261 | 0.287
0.000 | 0.000
0.000 | 0.000